5by5 | Mac Power Users #65: Workflows with Horace Dediu

(Note this is not the Critical Path, but a guest appearance on the sister show Mac Power Users.)

Episode #65 • December 5, 2011

Katie and David are joined by Asymco publisher Horace Dediu, who talks about how he researches and publishes his analysis of the mobile marketspace and his thoughts on the future of presentation tools.

via 5by5 | Mac Power Users #65: Workflows with Horace Dediu.

Does Growth Matter?

In last week’s discussion of Apple’s (historically low) valuation, comments arose that perhaps the company’s discount is not unique. Can we look at comparable companies and determine whether the relationship between growth, size and valuation are consistent?

The challenge is in finding “comparable” companies. Apple is characterized by being large in terms of market capitalization, highly profitable, in the technology sector and growing relatively quickly. One can find a cohort of companies with each of these characteristics but not all.

Here is an attempt at looking at the largest companies by Market Capitalization (the so-called Mega-caps) to spot patterns of valuation. Some of the companies in the top 20 mega-caps were technology companies so I thought I’d highlight them. I then also added a few of the top 20 technology companies by capitalization to create a larger sample.

The group I settled on is shown in the list below ranked by market cap.
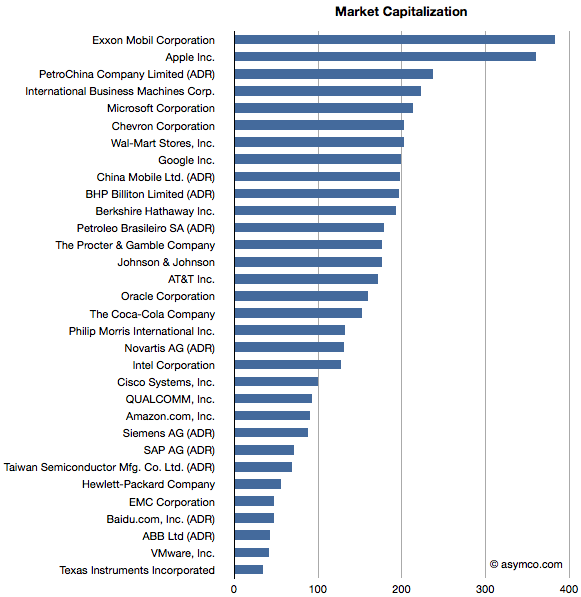
Companies below $130 Billion in market cap (i.e. below Novartis) are in the top 20 technology list but not in the top 20 overall list.

I then plotted the P/E rate vs. 5 year Growth Rate for these companies, separating the tech sector by color (Red):
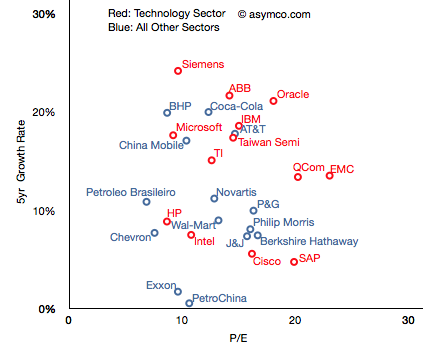
The pattern is not encouraging. It appears that there is no correlation. Perhaps the technology companies are, as a group, further up and to the right, but overall they are equally unobservant of growth.

For example, SAP has grown less than 5% in five years and yet enjoys a P/E of 20 whereas Microsoft has grown 18% and has a P/E of less than 10. The non-technology sector companies are similarly broken. Berkshire Hathaway, a conglomerate, is rewarded for slow growth and China Mobile is punished for relative high growth.

But you’ll notice that some companies are not on this chart. That’s because they are outliers. Their growth or P/E are so far out of this cluster that the would make it impossible to discern individual performance. The complete “top 20” picture is shown in the following chart which will require either a large display or a lot of scrolling (1300×1364 pixels): Continue reading “Does Growth Matter?”

The big bang theory of computing

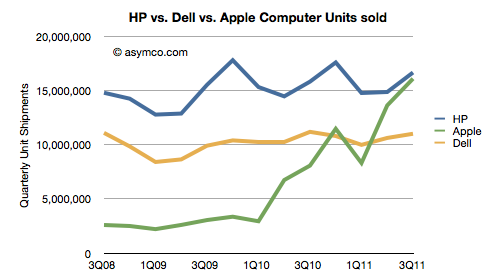
HP’s CEO Meg Whitman admitted that, when iPads are included, Apple will overtake HP as the world’s leader in computer shipments.

“We need to improve our game and our products to take over the leadership position. Apple could go past HP in 2012. We will try to become the champion in 2013.

When the quarterly shipment data is seen as a chart the doubt of this happening disappears:


Note that the combined iPad+Mac has already overtaken Dell. In fact, Continue reading “The big bang theory of computing”

The thermodynamics of Apple's share price

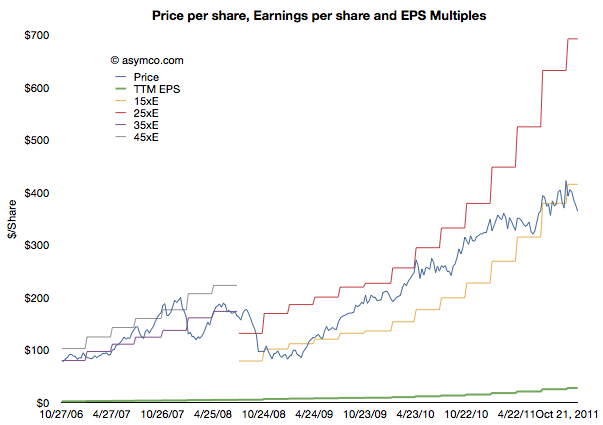
Andy Zaky at Bullish Cross wrote a great post on Apple’s valuation, showing the deep discount of Apple’s earnings vs. an average company. It essentially states that Apple’s money is not green.

Felix Salmon took it forward by enumerating a few explanations that might be used for the despondent valuation. None are successful arguments, but that should not be a surprise.

To understand the phenomenon a bit more precisely, I maintain and think about these charts:

This shows Apple’s share price (“P” in blue) and its earnings per share (“E” in green). In addition Continue reading “The thermodynamics of Apple's share price”

Interactive charts for Apple's product lines

Warning: This requires Flash.

This is a data set that shows Apple’s product-level performance according to Units sold, Average Selling Prices, Cost of Sales, Gross Margin, Unit Growth, Revenues, Revenue Growth and Gross Margin contribution. It, along with all the other data sets are available under the Products menu at the top of this page.

Default settings:

  • Line Chart
  • Y-Axis set to Revenues.
  • Color set to GM (Gross Margin percent).

Continue reading “Interactive charts for Apple's product lines”

Visualizing Mobile Phone Vendor Performance Through Motion Charts

Warning: This requires Flash.

Try the following settings:

  • Set y-axis to Profit (units: $ Billion)
  • Set x-axis to Volumes (in Millions/quarter).
  • Set Size: Revenues in $Billion. (Scroll within gadget to see Size selector).
  • Set Color: ASP (Average Selling Price in US Dollars)
  • Press Play or use scroll bar to scrub through time.

Note the “Vendor data” tab where you can see the source data and options for different chart types (upper right of chart).

Continue reading “Visualizing Mobile Phone Vendor Performance Through Motion Charts”

How many iOS devices will be sold in 2012?

There are several methods I turn to when estimating device sales.

Top-Down Demand analysis

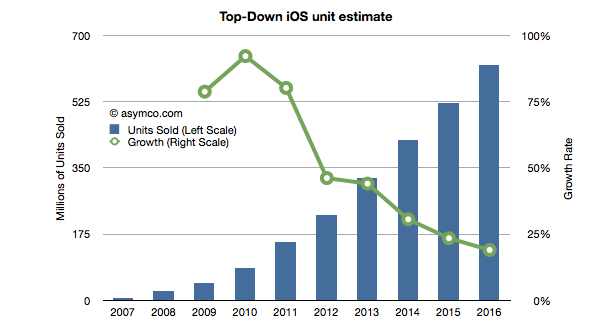
The first is to look at so-called top-down views of the demand. This method takes a view of the overall phone market and assumes share for smart devices and, further, shares for individual platforms. There are several estimates out there. The most recent is Ericsson’s Traffic and Market Data Report, released November 7 2011.

It concludes that in five years’ time mobile subscriptions will reach 8.4 billion of which smart devices (incl. tablets) will total 6.2 billion. As iOS has approximately a 250 million install base at end of 2011 and as the total base from Ericsson’s estimate for 2011 is 1.44 billion then Apple’s share is approximately 17%. If we assume that Apple will be able to increase smart device share to 20% (3 percentage points in five years) then by 2016 Apple will need to have 1.24 billion iOS subscribers.

Assuming that half the installed base upgrades every year and Apple adds devices required to reach the install base necessary (1.24b or 20% share) leads to the following unit sales projection (I’ve added 2008 through 2010 actuals and 2011 estimates based on my own current Q4 projections).


This Approach yields an estimate of Continue reading “How many iOS devices will be sold in 2012?”

5by5 | The Critical Path #14: The Super-platform ecosystem

The Critical Path show switches format for this week’s episode. I interview a guest.

5by5 | The Critical Path #14: The Super-platform ecosystem.

The idea is that rather than just telling stories and interpreting the world from my point of view, I should also ask others to teach from their experience.

In this case I discuss the disruptive potential of cloud computing with Randy Bias. Randy is the CTO of Cloudscaling, a designer of infrastructure cloud systems and a vast knowledge of the challenges and value of what we now call cloud systems. I’ve consulted for Randy in the past and I thought he could add a lot to the understanding of super-platforms. Super-platforms, you may recall, is a term I used to describe the coupling of Web Services and Devices in a mutually inter-dependent business model. I introduced the concept as a way to think about Siri and iCloud and potentially the Kindle and Amazon in general.

In this show I ask Randy to comment on the thesis that devices and cloud systems as a coupled system are a potential disruption to both the device-only model of computing and the cloud-only model of services. In other words, is the new ecosystem the coupling of devices with backend cloud APIs? We also touch on the scope of Apple’s data centers and the way we can calibrate the investment.

I think this is a ripe area of research and thinking about the future of computing. It will require learning a new way of measuring “performance” of solutions and the businesses built around it. It will take a multi-disciplinary approach to ferret out the key value propositions.