The diffusion of iPhones as a learning process

All theoretical and empirical diffusion studies agree that an innovation diffuses along a S-shaped trajectory. Indeed, the S-shaped pattern of diffusion appears to be a basic anthropologic phenomenon.

This observation dates as far back as 1895 when the French sociologist Gabriel Tarde first described the process of social change by an imitative “group-think” mechanism and a S-shaped pattern.1 In 1983 Everett Rogers, developed a more complete four stage model of the innovation decision process consisting of: (1) knowledge, (2) persuasion, (3) decision and implementation, and (4) confirmation.

Consequently, Rogers divided the population of potential adopters according to their adoption date and categorized them in terms of their standard deviation from the mean adoption date. He presented extensive empirical evidence to suggest a symmetric bell shaped curve for the distribution of adopters over time. This curve matches in shape the first derivative of the logistic growth and substitution curve as shown below. Screen Shot 2013-11-06 at 11-6-1.51.57 PM

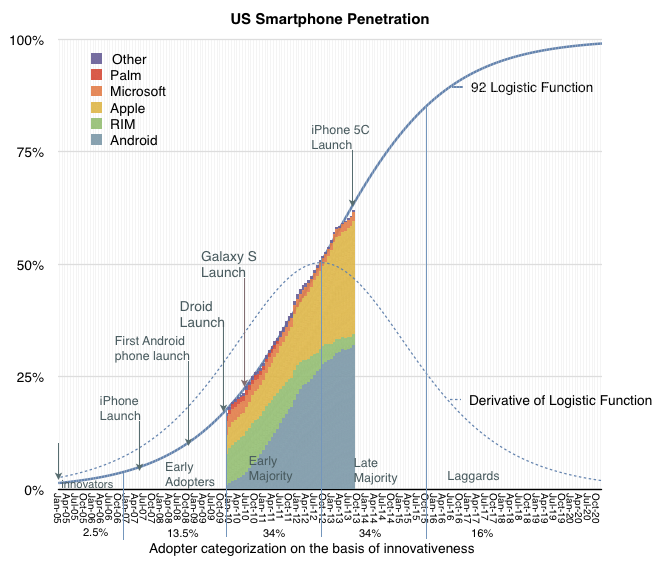
In the graph above I applied the Rogers adopter characterization to the data we have on the adoption of smartphones in the US. The latest data covering September is included.

Continue reading “The diffusion of iPhones as a learning process”

  1. Tarde was probably influenced by mathematician Pierre François Verhulst who first published the logistic function in 1845 []

Do ads work? The ad budgets of various companies

Microsoft spent $2.6 billion for Advertising in the fiscal year ended June. Apple spent $1.1 billion in its fiscal year ended October.

Other companies will report their full year ad spending later but their previous years’ spending is shown below.

Screen Shot 2013-11-04 at 11-4-4.55.03 PM

I added a second graph showing the percent of sales that each ad budget represents. Note that Coca Cola retains the crown as the most prolific advertiser when it comes to budgeting.1

Continue reading “Do ads work? The ad budgets of various companies”

  1. Think of it as 7 percent of every Coke purchase going to pay for the ad that presumably got you to buy it. []

Owing how much to how few?

For the year ending October Apple’s R&D costs were $4.475 billion. These costs have been rising. Though, as the company explains, not faster than net sales:

The growth in R&D expense was driven by an increase in headcount and related expenses to support expanded R&D activities. Although total R&D expense increased 32% and 39% in 2013 and 2012, respectively, it remained fairly consistent as a percentage of net sales.

[My emphasis]

We can see this in the following graph:

Screen Shot 2013-11-01 at 11-1-4.37.48 PM

R&D has remained very nearly 3% of sales since at least 2005.


SG&A Expenses barely grew however:

The growth in SG&A during 2013 was primarily due to the Company’s continued expansion of its Retail segment and increased headcount and related expenses, partially offset by decreased spending on professional services.

The change in R&D and SG&A on a full-year basis is shown below.

Screen Shot 2013-11-01 at 11-1-4.42.06 PM

I emphasized the mention of increases in headcount. We cannot know with any precision what portion of last year’s $15 billion in operating expenses went toward wage expenses since there are other costs such as advertising1 commissions and public relations in the case of SG&A and outside services, equipment leases, in the case of R&D. However, it’s more likely that wage expenses are a far larger proportion of total R&D than they are of SG&A.

My estimate, based on wage rates, is that there are approximately 15,000 R&D staff at Apple.

Screen Shot 2013-11-01 at 11-1-4.42.49 PM

If we divide sales by this number we get $11.4 million in sales per engineer.

  1. Apple’s advertising expenditures for fiscal 2013 were $1.1 billion or 10% of SG&A or 0.64% of sales. []

The Quantum Leap in Retail

In fiscal 2013 there were 395 million visits to Apple retail stores. In 2012 there were 372 million.

Screen Shot 2013-10-31 at 10-31-2.15.13 PM

The difference is approximately the population of Australia. This was in addition to the population of the US and Canada already passing through. Although this is a fun way to think about total traffic, it does not reflect performance of the stores themselves since new stores are always being opened. 21 new stores in 2013, to be precise.

Screen Shot 2013-10-31 at 10-31-2.15.21 PM

The better benchmark should be the number of visitors per store.

Screen Shot 2013-10-31 at 10-31-2.17.15 PM

This shows that, except for seasonal peaks, the visitors per store per quarter has been a fairly steady 240k since mid-2010. What’s more, this rate was also remarkably steady at around 160k/store/quarter from 2007 to 2010.

So what caused this quantum jump1 in traffic? Continue reading “The Quantum Leap in Retail”

  1. “Quantum leap” is often used to mean “giant leap” but in the original usage it meant a specific, discrete jump []

How many iOS devices will be produced in the next 12 months?

Apple’s capital expenditures for product tooling, manufacturing process equipment, corporate facilities and infrastructure has followed very closely their production of iOS devices. The pattern is shown in the graph below.

Screen Shot 2013-10-30 at 10-30-2.12.28 PM

Note that although reported expenditures did not match forecasts for 2012 and 2013, the differences nearly cancel each other.1 The company’s forecast for fiscal 2014 is shown as well.

The orange line shows iOS unit production2 with the scale on the right-side axis. Note the correlation with forecasts on CapEx. The relationship can be seen more clearly in the following scatter plot.

Screen Shot 2013-10-30 at 10-30-2.33.26 PM

I added the 2014 Forecast ($10.5 billion from the latest 10-K filing). If the relationship holds into next year then the iOS unit shipments should be between 250 million and 285 million.3.

  1. I suspect that the difference might be caused by a payment being brought forward in 2012. []
  2. Technically, shipments []
  3. The equation for the trend line shown suggests 285,908,000 units []