The Essence of Apple’s Decision

“The essence of ultimate decision remains impenetrable to the observer – often, indeed, to the decider himself.”

John F. Kennedy

The fact that we ourselves don’t know how we make decisions has not stopped us from proclaiming, loudly, that we know how everyone else decides. Such proclamations about others’ decisions are especially confident and assured the more important, or highly visible, the decision.

This is at the heart of analysis for large companies, especially Apple. The premise that decisions on product, positioning, investment and a myriad other necessary functions are guided deliberately through the will of single individuals in positions of power; rational single Actors that are directed by some rational, typically economic, calculus is pervasive. Without pause, we assume that analysis consists of de-compiling the calculus of that single Actor.

The diversity of opinion on Apple stems from disagreements about whether the calculus is purely economic or some other—aesthetic, virtuous or greater good, “satisfaction maximization” or something else that motivates the Actor.

However this is not the only decision process. It is in contrast to two other decision making processes: the bureaucratic model where decisions are the result of analysis of constraints, resulting in a “best compromise” between multiple sub-problem solutions.

Or the “political model” where maneuvering between factions with fractional power results in a consensus decision based on a political (zero-sum?) calculus.

One could classify these decisions processes as Graham Allison did in “Essence of Decision: Explaining the Cuban Missile Crisis“: The Rational Actor, The Organizational Process or the Governmental Politics models. That landmark work opened our eyes to the variety of ways organizations—not just governments—decide. It clashed with, to the point of refuting, the economic rationality model typically attributed to Milton Friedman.

When reading commentary on Apple decisions I almost always hear the causality ascribed to the “Rational Actor” model where the Actor is a person of great importance. The importance imparted upon them implicitly by being a “visible” person. That visibility comes from having been put forward by the company itself. We know of the Apple Actors as those whose names are revealed and we assume that those not visible are not Actors.

But, of course, visibility is a design. The company, known for its design, takes that ethos to its communications, and communicating who is visible and thus who is “an Actor” is a design decision. So we are led to believe that decisions are made by the Actors and who the Actors are is determined by the very entity we are trying to analyze.

Do you see the problem?

Rather than take the comfortable road and analyzing Apple by the surface that is exposed, the better approach might be to toss the Rational Actor model and think about the Organizational or the Political Models.

How does the company process information? How does it generate consensus? How does it deal with motivating employees? How does it allocate resources? How does it evaluate productivity? How does it balance morale and turnover? These are what Clay Christensen classified as “Processes” rather than “Resources” questions. The Actor model assumes all decisions come from individuals who are, in a large organization, Resources. They come and go. They can be hired and fired.

The Political model asks further if the decision came from maneuvering between visible and invisible Actors. I would argue that the political dimension is prevalent in most large organizations and it is corrosive to the overall health of the organization. I would also argue that Steve Jobs designed Apple specifically to avoid the Political process. But we must still assume that it’s at work to some degree. It’s like entropy.

When hearing about big staff changes at Apple, take a moment to reflect what decision processes are at work. How did that one (visible) Actor really influence the decisions made? Are you ascribing too much to them because they are visible? Are you assuming that tens of thousands of other individuals are not influential? That they are minions hired to act and not to ask questions? Doesn’t Apple also say they hire people to tell Apple what to do?

Allison did not say which model applied to the Cuban Missile Crisis. He left it to the reader to decide.

I will do the same when it applies to any particular Apple decision.

AiriPods

The Apple Watch is now bigger than the iPod ever was. As the most popular watch of all time, it’s clear that the watch is a new market success story. However it isn’t a cultural success. It has the ability to signal its presence and to give the wearer a degree of individuality through material and band choice but it is too discreet. It conforms to norms of watch wearing and it is too easy to miss under a sleeve or in a pocket.

Not so for AirPods. These things look extremely different. Always white, always in view, pointed and sharp. You can’t miss someone wearing AirPods. They practically scream their presence.

For this reason wearers, whether they want to or not, advertise the product loudly. Initially, when new, they looked strange, even goofy. But the product’s value to the wearer overcame any embarrassment and for those courageous enough to wear them, they became a point of pride. As all things distinctive enough, the distinction rubs on the user and that distinction begets new users and new distinction, and so on. So now we have a bona fide cultural phenomenon.

I have both my son and parents angling to get these things. I have not seen this universal appeal recently, even for the watch. You have to explain the watch. The AirPods explain themselves. The only thing which AirPods do remind me of is the original iPod. The iPod-and-white-earbuds had a similar signal/function ratio. Looks distinctive, works well, nails the job to be done and is self-describing. The “iconification” of white was the phenomenon of its decade.

One wonders how much of this behavior is by design or, more precisely, engineered by designers. Did Jony Ive’s team plan on users “flexing” with their AirPods? Did they make them distinctive on purpose with the stalks pointing down vs,, for example, wrapping around the back of the ear for a more discreet look? Was it just good luck and the form followed function? It’s hard to imagine that taste could be engineered but here we are.

Whether planned or not, the newest AirPods offer a functional upgrade with no visual upgrade. This is noteworthy because whatever they got right with the original design they decided not to mess with it. You can’t tell if someone is wearing the newest AirPods or the originals.

As far as the added functionality it is typical Apple: faster connections due to a new chip, longer talk time, longer listen time, voice-activated Siri and wireless charging. Broadly speaking they are just better in ways that need to better and not better in ways they are good enough.

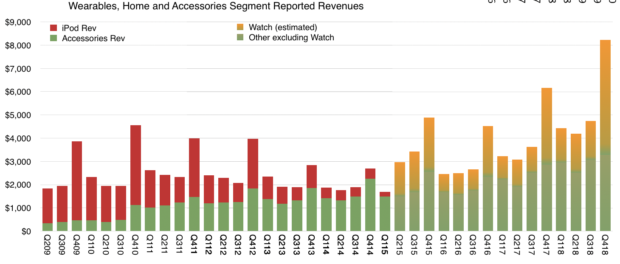
The product is part of the “wearables” category at Apple which includes watch and is growing almost 50%/yr. and not from a small base either. The following graph show the history of the segment since 2009 (before the iPod peaked).

As can be seen, Wearables and Home segment grew out of the iPod segment, through “Other” products and is now almost double what the iPod used to be alone.

It should be noted that the AirPods can be paired directly with the Apple Watch and used independent from the iPhone. If not from this point alone, culturally the iconic white AirPods and jewel-like Apple Watch embody the spirit of the iPod.


mini

We want things to get better. The desire of improvement and an increase in performance is seemingly innate. The old adage goes that using the word “new” is the most effective way to increase sales. “New & Improved” if you want to be redundant.

For many in technology, New & Improved means faster with more of every measurable parameter. More memory, more pixels, more storage, more bandwidth, more resolution. In devices, the tendency has been to communicate “new & improved” through an increase in screen size. We are subject to this to such an extent that phones are becoming unusable with one hand, stretching screens to the edge of the device and then wrapping those screens around the edges and then even folding the screens so that we have to unfold or unroll to use the product. Maybe an origami phone is in the works.

But there is a parallel movement where “New & Improved” means smaller. This is the trend to miniaturization. Smaller is better because it’s more portable, more conformable. Things sold by the ounce are better than things sold by the pound. The best computer, the best anything, is the one you have with you and having it with you is more likely if you can take it with you. So that which you can take with you is the best. QED.

Apple has had a great history of miniaturization. The original Macintosh was tiny compared with personal computers of its day. It had a handle so you could take it with you. Apple pioneered laptops with breakthroughs in utility and form which made them truly portable. The iMac followed with a degree of integration and portability which made it iconic. Of course the iPod and iPhone were marvels when they first appeared.

Over the years these products expanded into ranges with “good, better, best” type segmentation. The bigger being the best in performance and the smaller typically being the most convenient. However it seemed that the positioning was toward “bigger is better” for a lot of these products. The iPhones Plus, the iPads Pro, etc. As even the largest were getting thinner, the “mini” versions appeared to be neglected. You could get “good enough” portability from the larger products so why bother with the minis.

It came to a head when the iPhone SE was discontinued last fall. Its demise felt like the end of an era. I always considered the SE as the “Steve Edition”. It was the last design Steve Jobs was involved in and it pained me to see it go. With it seemed to go the positioning around “mini”.

But also last fall we saw a re-boot of another almost-forgotten mini: the Mac mini. For me the Mac mini was quintessentially Jobsian. I remember that he loved tiny products. His launch of the iPod nano was spectacular; reaching into his jeans’ watch pocket to pull it out on stage. Holding the Mac mini up as if a tiny tray. Even the iPod shuffle was a quirky and lovable idea1. And let’s not forget the Mac Cube which made the iMac look huge.

When the Mac mini was released last fall in Brooklyn with a huge spec bump and a thunderous reveal I thought something was up. When the MacBook Air was also out at the same event I felt that the company was signaling something. Perhaps a re-dedication to the low end.

Also in parallel there is the wearables product line. The AirPods and the Apple Watch are jewelry. The essential qualities of products you wear are that they be small and beautiful. The smaller the better. Above all, both the Watch and AirPods are marvels of miniaturization. They pack so much in so little volume and that volume is shaped in such an aesthetically elegant way that they become daily essentials. I use my Apple wearables more than any other Apple product. Watch glances and time with AirPods exceeds the iPhone unlocks and iPhone use time. The fact that we don’t even realize that the smallest Apple products are also the ones we use most is a testament to their conformability to us.

So the Mac mini that is suddenly the Mac Maxi in performance, the MacBook which is an extraordinarily small laptop, the wearables success, all pointed in a direction that the iPhone did not: that “mini” was back.

And now we see the iPad mini being re-launched with a huge spec bump. We should take the hint. The iPad mini is just charming. I have been trying it out for a few days and it has worked its way into my routine. I have an iPad Pro that I use on a desk to design presentations (and to deliver them). I use it with a keyboard for dealing with email on my lap or on a plane and take it instead of a laptop when going to meetings.

But the iPad mini worked its way to my nightstand. It the one I reach for when on a couch. It is like an iPhone but when you’re at home it’s better than the iPhone because you can linger on that new true tone screen. It works well one handed. It now has Pencil support so it can be used for sketching and doodling.

I am an analyst not a product reviewer but I sense how it fills a gap between iPhones and larger devices–in a home setting. Of course it can be used in an office. It is much easer to take with you if you carry a laptop in a bag.

Fundamentally explaining mini is pointless. mini is something that is felt more than it is perceived. You can see the attraction of a tiny product only when you come face-to-face with it. In a picture it’s hard to get it–there is no frame of reference. What draws me to a MacBook or to a mini or a Watch is when it’s touched and held and carried or worn. The experience of the product is not how it works but how it works with you. You have to be part of it. It’s not asking “Does it look good?”. It’s asking “Does it look good on me?” mini means more personal.

That is the nature of mini and that is why I love the new minis: the iPad mini, the Mac mini, the MacBook (mini) and that is what I dare to hope that there is an iPhone mini coming.

  1. probably the first Apple wearable as you could actually pin it to your clothes []

A Billion Users

In the latest Apple Earnings report, Apple announced a few details that are relevant to the forecast of the business:

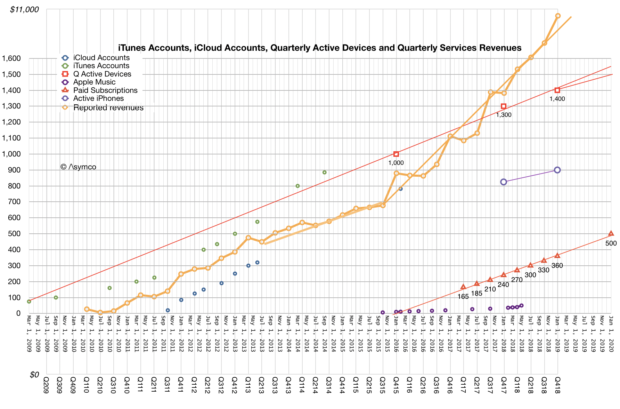
  • The global active installed base for iPhone reached an all-time high at the end of December, surpassing 900 million devices. This represents growth y-o-y in each of five geographic segments, and growth of almost 75 million in the last 12 months alone
  • There are now over 360 million paid subscriptions across the Services portfolio, an increase of 120 million versus a year ago. Apple expects to surpass 500 million in 2020.
  • The installed base grew to 1.4 billion devices by the end of December. This includes all-time highs for each of the main product categories and all five of their geographic segments.

I added all these data points to the previous reported figures related to installed base, subscriptions and Services revenue.

Note that all the data sets show a linear growth path. Most prominent is the paid subscriptions line which is growing at exactly 30 million per quarter. The new projection of 500 million by 2020 is exactly in-line with this projection.

Note also that active devices and iPhones are on similar trajectories. The figure for active iPhones is interesting because it very closely relates to active users. It’s extremely likely that 900 million active iPhones means 900 million active iPhone users. An iPhone is useful if it has a data plan associated and it’s a costly proposition for most people to have multiple devices and multiple data plans.

This close relationship between iPhone usage and iPhone users means that we can approximate the entire unique user base for Apple. There might be “10s” of millions of users who use Apple devices but don’t use iPhones but there might also be multiple iPhones for some users1

So it’s very likely that the total Apple user base is between 900 and 1 billion. If it’s not 1 billion now then it’s very likely it will be 1 billion within 12 months.

In May 2010 I made the prediction that Apple would reach a billion users in 5 to 8 years. The prediction was based on the first 100 million iOS users. The company reached one billion active devices in a bit over 5 years and is about to reach 1 billion users 8 years since.

Apple stated in the latest conference call that very little of Services revenues depends on the any previous quarter’s unit sales confirming that Services is driven almost entirely from the user base. With almost a billion users, 90+% loyalty rate, 95% satisfaction, 120 million paid subscriptions and 75 million new users/yr, the analysis of Apple as a services company is becoming interesting.

  1. I would be inclined to assume that there are more non-iPhone Apple users than multiple iPhone users. []

Apple’s Unit Economics

For the last two years I’ve been studying the transportation economy and introducing the idea of Micromobility. Simply, Micromobility promises to have the same effect on mobility as microcomputing had on computing. Bringing transportation to many more and allowing them to travel further and faster.  I use the term micromobility precisely because of the connotation with computing and the expansion of consumption but also because it focuses on the vehicle rather than the service. The vehicle is small, the service is vast.1

One of the elements of analysis for Micromobility is the notion of Unit Economics. The idea is that each vehicle can be seen as an independent business. It requires an investment, has a revenue attached, requires operating costs and fixed costs and finally, hopefully, generates earnings. A fleet’s economics is therefore a multiplication of the unit economics by the fleet size. A similar partial construct exists for mobile network operators where the network revenue is defined by ARPU (average revenue per user). In consumer hardware we also have the idea of ASP (average sales price) and BOM (bill of materials) which describe the revenue and variable cost of each device.

In the case of Micromobility the unit economics is more broadly applied in being an entire P/L statement for each vehicle. One example for the e-scooter sharing company Bird is here. If the unit economics of Bird is consistent across geography and time then the entire business can be valued based on one “average unit”. Measuring the health of the business can thus be summarized in BOM, Utilization, Lifespan, Attrition and Cost structure or one unit.

For some time now I’ve advocated a similar approach for Apple.

Continue reading “Apple’s Unit Economics”

  1. If you want to learn about the real future of transportation sooner rather than later, do consider coming to the Micromobility California conference. []

Traffic Acquisition Costs

In June of this year Apple reported that it had paid a total of $100 billion to developers. That is the 18th such figure given in the 10 year history of App Store, making the progress of payments and hence revenue and spending easily trackable.

The other regularly reported figure is the business segment revenue where App sales are currently allocated. Now called “Services” this omnibus segment includes many other sources of revenues such as:

  • Digital Content (Books, Music downloads, Video downloads–including TV shows and movies and movie rentals.)
  • AppleCare, Apple’s extended warranty service.
  • Apple Pay, transaction fees
  • Apple Pro Apps, including Final Cut, Logic Pro, Motion, Aperture
  • Licensing including “Made for iPhone/iPad”
  • One-time settlements of various lawsuits.
  • Other Services revenues which include
    • Apple iCloud-related services
    • Music Match
    • Music subscriptions
    • Other third party subscriptions (commissions)
    • Third party licenses

This combined Services segment is significant with $35 billion revenues in the last 12 months. This is quite a jump from 2016 when Services had crossed $25 billion. At the end of 2016 Apple said it expected Services revenue to double by 2020. With a growth rate since then of 25% the company is on track to reach its target one year early.1

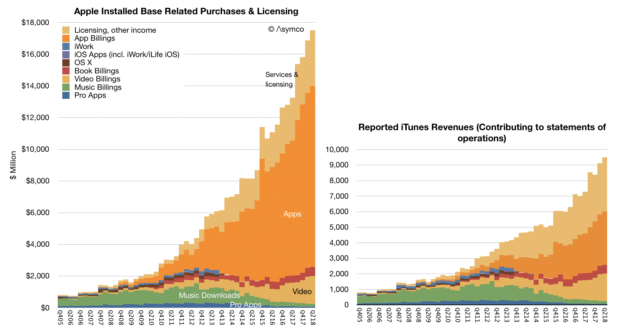
Consumer spending on Apple services includes more than what it books as revenue since only the (typically) 30% of App Revenues is considered Apple’s revenue. Including the payments to developers, Services generated over $65.5 billion/yr in billings. This will reach $100 billion/yr in 2 years. The difference between reported revenues and consumer spending is shown in the following graphs.

I described the visibility into App Store revenues (which is the orange area in the graphs above) but the other sub-segments of Services are much more difficult to ascertain. Of special interest is Other Services which includes very high margin services. As part of that there is a peculiar source of revenues: Google.

It’s known that Google pays Apple for the default placement of Google search within Safari on iOS and Mac OS. That payment is registered by Google as a “Traffic Acquisition Cost” or TAC. TAC is essentially payment for distribution where what is granted by the distributor is access to queries (traffic.) This way Apple acts as distributor for Google. So, for that matter, does Firefox which also receives TAC payments.

What is peculiar is that the amount of TAC paid by Google to Apple is becoming staggering.

A few years ago Google was paying over 20% of its revenues as TAC. Recently that ratio rose to 23%. Bernstein analyst Toni Sacconaghi estimated that Google paid Apple $1 billion in 2014 as TAC and that payments to Apple were about $3 billion in 2017. Now Goldman Sachs analyst Rod Hall estimates Google could pay Apple $9 billion in 2018, and $12 billion in 2019.

This is starting to look interesting but is it believable?

My own estimate of Apple’s Other Services (which includes TAC revenues) is a run rate of $15 billion for calendar 2018. This makes $9 billion (60%) from Google quite challenging but not impossible. The remaining $6 billion needs to account for Apple’s own cloud and subscription service revenues.

Does this make sense given Google’s spending? TAC payments to distribution partners in Q2 were $3 billion. The $9 billion/yr assumption implies a $2.25B/quarter payment to Apple. That would be 75% of Google’s distribution costs. That also sounds reasonable given the high utilization of iOS relative to any other platform.

An increase to $12 billion for next year is also quite a claim but it certainly is possible. I don’t have a basis for making this estimate but the assumption of growth leads me to conclude that the payments are tied to actual traffic generated.

In other words the two companies have an agreement that Apple is paid in proportion to the actual query volume generated. This would extend the relationship from one of granting access for a number of users or devices to revenue sharing based on usage or consumption.

Effectively Apple would have “equity” in Google search sharing in the growth as well as decline in search volume.

The idea that Apple receives $1B/month of pure profit from Google may come as a shock. It would amount to 20% of Apple’s net income and be an even bigger transfer of value out of Google. The shock comes from considering the previously antagonistic relationship between the companies.

The remarkable story here is how Apple has come to be such a good partner. Both Microsoft and Google now distribute a significant portion of their products through Apple. Apple is also a partner for enterprises such as Salesforce, IBM, and Cisco. In many ways Apple is the quintessential platform company: providing a collaborative environment for competitors as much as for agnostic third parties.


  1. To calibrate this consider that Facebook revenues for the last 12 months were $48 billion and it now has a market capitalization of $468 billion or 41% that of Apple whereas Services consists of about 14% of Apple’s total revenues. []

Lasts Longer

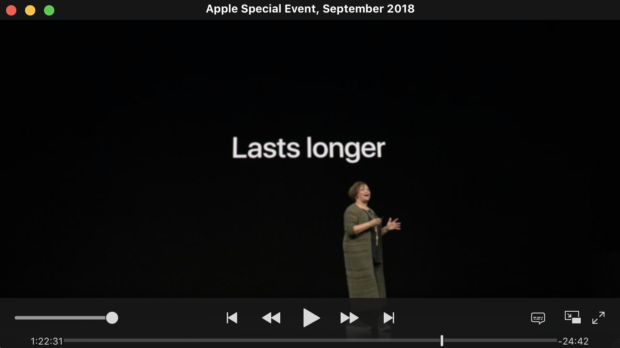
I think Lisa Jackson’s presentation at the September 2018 iPhone launch event was perhaps the most interesting and most profound.

Lisa Jackson is Apple’s vice president of Environment, Policy and Social Initiatives. Previously, Ms. Jackson served as Administrator of the U.S. Environmental Protection Agency (EPA). In her role at Apple she has been responsible for the transition to 100% renewable energy use by Apple across all its facilities.

This goal has been achieved and it’s a remarkable achievement deserving congratulations. But her presentation was noteworthy for setting a new goal.

She laid out a goal for Apple to eliminate the need to mine new materials from the Earth.

She said that to reach that goal Apple will have to do three things:

  1. Sourcing recycled or renewable materials for all products.
  2. Ensure that Apple products last as long as possible.
  3. After a long life of use, ensure that they are recycled properly.

It’s this second point that I thought would bring the house down.

To emphasize the second point she said Apple now strives to design and build durable products that last as long as possible. That means long-lasting hardware coupled with long-lasting software. She pointed out that iOS 12 runs even on iPhone 5S, now five years old. Because iPhones last longer, you can keep using them or pass them on to someone who will continue to use them after you upgrade.

She said that “keeping iPhones in use” is the best thing for the planet.

At this point in the presentation I wondered if everyone would rush out of the room and call their broker to sell Apple shares. One premise of investing in durable goods hardware companies is that value depends on frequency of upgrades. If products are not replaced frequently they do not generate revenues and the company selling them ends up growing very slowly if at all after markets saturate. The smartphone business is certainly approaching saturation and the implication of making Apple products more durable would imply lower revenues from replacements. This anxiety around replacement rates and extended lives is used by analysts to discount future cash flows and if those lifespans are extended price targets come down.

So why would Apple want to do this?  What is the logic of this durability focus as a business model? It may be good for the environment but is it good for the bottom line?

Of course, there would be not much business without an environment and we should all strive for sustainability.  But this is an existential observation, and it’s defensive. The important call to make is that Apple is making a bet that sustainability is a growth business.

Fundamentally, Apple is betting on having customers not selling them products.

The purpose of Apple as a firm is to create and preserve customers and to create and preserve products. This is fundamental and not fully recognized.

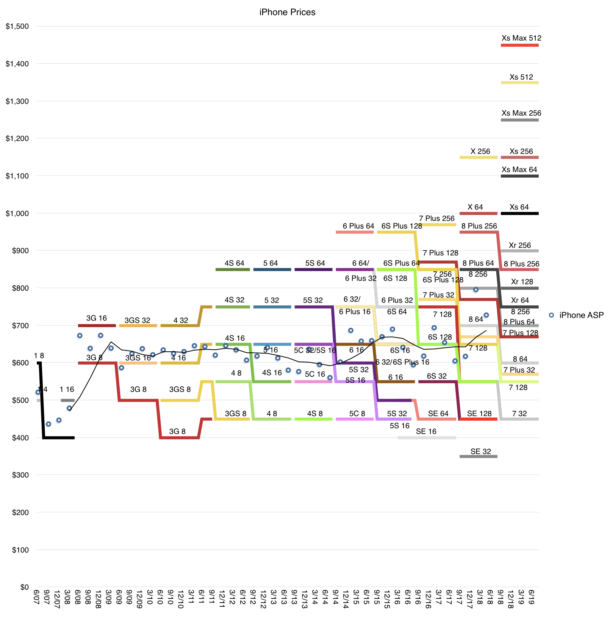
To understand how this works, if you look at the pricing graph below, you can read it as a story of increasing prices for a decreasing market share. But if you understand that each advance in products increases absorbable1 utility then the cost per use remains steady or declines.

An iPhone at $1200 may be less expensive than an iPhone at $600 if the $1200 version lasts twice as long as is used twice as much each day. The $1200 phone delivers 4x the utility at twice the price, making it half the price. By making more durable products, both in terms of hardware and software, the customer base is satisfied and preserved.

Practically, the initial buyer may resell the iPhone and that 2nd hand devices may be sold yet again. This means an iPhone could have three users over its life and thus it could end up expanding the audience for Apple by a factor of 2 or even 3.

The expanded audience is offered accessories, additional products such as wearables and, of course, services. These residual business models are certainly profitable, perhaps even more so than the iPhone.

Overall Apple has 1.3 billion devices in use and perhaps as many as 1 billion users. This base is certain to expand and it will expand more rapidly with durable devices and software.

This is a hardware-as-platform and hardware-as-subscription model that no other hardware company can match. It is not only highly responsible but it’s highly defensible and therefore a great business. Planned obsolescence is a bad business and is not defensible.

Therefore the statement that Apple now prioritizes device and software longevity is very important and I consider it one of the most important statements made during the 2018 iPhone launch event.

  1. Insoluble  utility is very dangerous and it’s important to qualify e.g. higher storage capacity that people hunger for or better cameras that increase picture taking from features that are neat but don’t get utilized []

Preview of the holiday quarter

Every October, at the end of its fiscal year, Apple files its Form 10K or annual report. In this report the company includes a section titled “Capital Assets” which details expenditures for capital equipment. This is last year’s entry:

The Company’s capital expenditures were $14.9 billion during 2017. The Company anticipates utilizing approximately $16.0 billion for capital expenditures during 2018, which includes product tooling and manufacturing process equipment; data centers; corporate facilities and infrastructure, including information systems hardware, software and enhancements; and retail store facilities.

Note that there are categories of spending detailed and that their order might indicate the degree of such spending, suggesting that product tooling and manufacturing equipment is likely to be the costliest category.

After this report, during subsequent quarters the company may update this forecast of spending. In the last (third fiscal) quarter the entry was as follows:

The Company’s capital expenditures were $11.1 billion during the first nine months of 2018 . The Company anticipates utilizing approximately $17.0 billion for capital expenditures during 2018, which includes product tooling and manufacturing process equipment; data centers; corporate facilities and infrastructure, including information systems hardware, software and enhancements; and retail store facilities.

Note that the forecast of $16.0 billion was updated to $17.0 billion and the first 9 months’ expenditures were $11.1. Since there is only one quarter remaining1 it’s reasonable to assume that the company’s forecasts are more likely to be precise and that therefore the difference between total expected spending and already spent, i.e.f $5.9 billion remains to be spent.

The actual spending is not recorded quarterly but an approximate value is reported in the Cash Flow statement as “Payments for acquisition of property, plant and equipment”. That can be tracked but it does not equal exactly the capital expenditure. For example, the quote above says expenditures were $11.1 billion through first 9 months but the total of all payments for acquisition of PP&E is $10.272 billion.

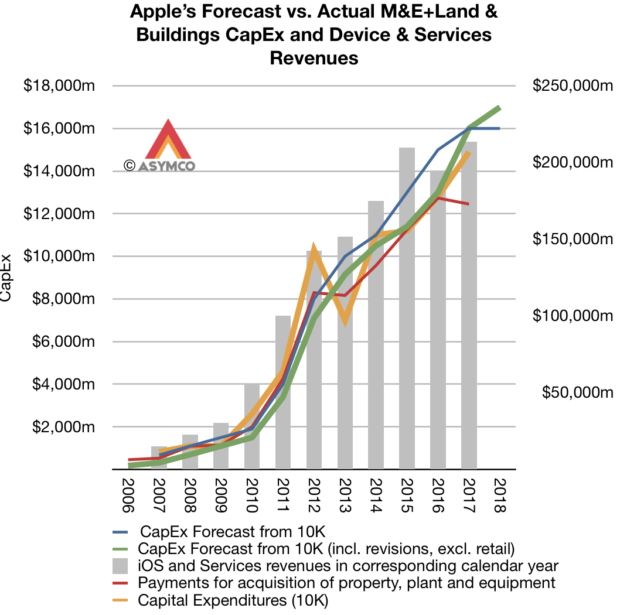
Minor2 differences, aside, this forecast and actual spending and payments data is significant because it is highly correlated to Apple’s overall business. Assuming that the spending on manufacturing equipment and information systems hardware (i.e. data centers) is in support of the iOS device sales and services we can try to show how sales correspond to spending with the following graph:

Here sales are shown as a bar graph and the various spending forecasts and actual payments are shown as lines. Also note that the spending and sales are offset by one quarter. The fiscal year is used for spending and the calendar year for sales. The reason is that spending is presumed to lead sales by approximately one quarter.

There are some notable discrepancies, especially with the 2012/2013 period when spending was brought forward a quarter thus showing a surplus to forecast in 2012 and a deficit in 2013. But apart from that, there is a broad correlation between spending and sales.

This means that the CapEx forecast in October is a good indicator of sales in the following year.

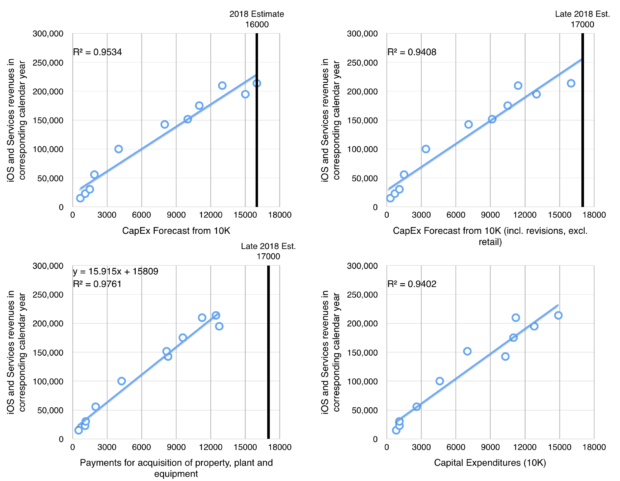
In fact, the relationship is can be shown with four scatter plots, one for each of the published figure:

I caution that this is a yearly forecast and it is revised through the year on a quarterly basis, sometimes up, sometimes down. It’s therefore not a perfect indicator and of course the relationship between sales and spending is not perfectly predictable. Note that there are four types of spending that can be measured, two are forecasts (one year and revised) and two are actuals (cash flow payments and reported total expenditures)

We can measure the best variable that fits the sales data through the coefficient of determination or R-squared. The best fit seems to be with Payments for acquisition of property, plant and equipment (R-squared of 0.976).

This gives the formula for yearly sales as 15.915x + 15809 where x is the expected total spending. That spending to date has been $10.272 billion and it’s probably going to exceed $16 billion for the year.

Using $16 billion spending total, we can calculate iOS products and services for calendar 2018 of $270.45 billion.

iOS and Services sales to date have been $103.2 billion with an estimate for next quarter of about 54.3 billion (based on guidance) and thus a total through Q3 of $157.5 billion. Subtracting this from the $270.45 billion expectation from the calculation above gives a fourth calendar quarter iOS revenue of $113 billion.

Adding $7 billion for the Mac results in a total net sales of 120billion. This therefore is what I’d put forward as a reasonable target for CQ4.

Note that this is equivalent to a growth of 36% from the 2017 fourth quarter.

[UPDATE: Original version used total sales rather than iOS related products and services (i.e. excluding Mac). The text has been edited to reflect the correct figures.]

  1. and since at the time the quarterly report is filed, only about 2 months remain in the quarter []
  2. To the extent that $1 billion can be considered minor []

Micromobility Summit 2018 September 5, Copenhagen

Last year’s Micromobility Summit was a great success. We had a great turnout and the presenters and audience met to discuss the future of this new modal shift that seemed so imminent.

Perhaps partly because of our meeting, the shift has since accelerated. The amount of capital allocated, firms participating and usage have all exploded. In one year micromobility went from a curious hobby to the biggest startup story in the world now attracting mainstream attention.

Bird, Lime, Skip have pioneered scooter sharing. Smide in Switzerland is offering e-bike sharing and Uber, Lyft and Didi made acquisitions. More OEMs and Tier 1 suppliers are betting on this sector and we have hundreds of new e-bike models entering the European market and literally billions of vehicle miles traveled using micromobility. 400 million users are registered in China alone with 70 million daily active.

Micromobility Summit 2017 was the catalyst of several startups that operate in the space today. It was great opportunity for like-minded entrepreneurs to discuss this market.

It’s time then to follow-up with the second Micromobility Summit. Coming almost exactly a year after the first, we will conduct a similar approach: speakers and panels covering the following topics:

  • Micromobility definition and categorization
  • Micromobility competitiveness relative to incumbents
  • Micromobility business models and asymmetry to macromobility
  • Regulation and evolution of normative behaviors

I will present research currently under peer review on the competitiveness of new modalities relative to existing and their conversion potential. Titled “When Micromobility Attacks”, it’s an adaptation of a paper just submitted to a peer-reviewed journal (written with ETH Zurich)

If you would be interested in attending or speaking let me know through the sign-up sheet at the event web page.

Apple Summit NYC

We are proud to announce the second investor summit dedicated to the long-term investors in Apple. It’s happening in New York City at The Merceron August 16th from 10am to 10pm.

We will host people interested in discussing the fundamentals of Apple as a business and how it operates as a recurring revenue model.

Titled “The Goose That Lays The Golden Eggs” it was inspired by a blog post from 2013 foreshadowing how human nature instinctively discounts Apple and yet how that nature is mismatched to how Apple actually works.

If you are curious about why Wall Street says “Sell” and Warren Buffet says “Buy” on Apple you might want to spend some time with us.

Agenda:

  • How to read the company’s performance given its published results. We will review how to build a model of the company’s financials and how it can be used to forecast the next quarter. We can go line-by-line through the income statement.
  • How to think about the markets Apple considers important. This is the best way to forecast the company’s performance beyond its current portfolio. This requires calibrating your sense of timing of innovations. What is too early, what is too small, what is something where Apple can’t exercise control? Innovation theory is essential to this understanding. If you know where Apple could go next and where it won’t it helps you build patience into your planning.
  • How to understand Apple’s culture and its resources and processes. This gets into the critical management question that leadership at Apple is concerned with. I’ve had a few conversations with and have some great insight from former managers. Curiously, this is Apple’s greatest competitive advantage and its sustainability is the key “moat” question. Most people don’t even realize that this is the most important question for investors.
  • How to understand the market’s reaction to Apple. If you understand the three points above it becomes necessary to juxtapose how others see the company. There is a compelling case of asymmetry of information even though “everyone” is watching the same data. I use the fable of “The Goose that Lays the Golden Eggs” to best describe how most people react when they observe Apple. Apple is something which cannot possibly exist and therefore it is fragile and must be treated as a transient system. It leads to deep discounting in the market. This cognitive illusion has an opposite: monopolies are over-valued because they are seen as invulnerable and permanent even though they are brittle. I use antifragility as another metaphor. Many anecdotes from Steve Jobs also indicate that he understood this asymmetry and instilled it in the company. Investors need to understand this dynamic in order to profit from it.

Sign up here.