
This is a good one.
Horace and Anders discuss Apple earnings, the iPhone X and take listener questions.
This is a good one.
Horace and Anders discuss Apple earnings, the iPhone X and take listener questions.
Source: ¿El iPhone 8 tiene lo que se necesita para ser un éxito?
The above interview was conducted October 17 with Carlos Morales
Editor en Jefe, Forbes Digital (Mexico).
The source questions and my answers in English are below:
How can we read the fact that the new iPhone lineup raised so little noise? There was no massive lines outside the Apple Stores and people demonstrated almost zero interest in the new models compared with the hype motivated by the iPhone 7.
I don’t know about you but I don’t like waiting in lines. I don’t think Apple considers waiting in lines to be a good user experience for its customers. Over the years Apple has been able to improve availability and online orders so that lines can be eliminated. I suggest a better way to gauge interest in new models and that would be to look at sales. Sales seem to be going up even as lines have been going down.
The iPhone 8. What do you think of the fact that the iPhone 7 is outselling the iPhone 8?
Is it a fact? I think this notion is coming from a survey of operator stores in the US over a short time period. The mix of phones has never been known and is a matter of speculation. The only data we do have is the average selling price derived by dividing the revenues by the number of units sold (and ignoring deferrals). This price set a new record during the last 12 months. Expectations are that it will increase to another record again next year. I might add that this has never been observed in the phone business as far as I know. The opposite has been the trend.
Whats the outlook for the the iPhone 8 vs the iPhone 7 and the iPhone X?
The iPhone 8 is likely to be the best selling model over the next 12 months. The iPhone X will be the best seller in the first quarter but I expect it will come second during the following quarters. The iPhone 7 will end up 3rd.
What do you think about the smartphone prices, aren’t they too high? How far can they be stretched ?
Smartphone prices are very low. World-wide, average smartphones sell for less than $300. You can see a break-down by region here.
iPhone prices are, on average, more than double the average of all smartphones. Note that apple’s latest line-up also includes the cheapest iPhone ever with the SE now starting at $350.
I don’t think the average selling price will increase in 2018 globally. It will probably decrease as it has for a long time. Average iPhone prices will increase but probably only by $10 or so.
The iPhone price tiers are well understood. I published an analysis here:
More important however is that the iPhone remains priced at about $1/day, no matter the model, and as such the value users perceive is very high. The most expensive iPhone costs about 8 cents per hour of use, 1.4 cents each time you unlock it and 1 cent for ever 25 interactions you have with it (touches or taps). On a per use basis the iPhone is extraordinarily cheap. I know of no consumer product that is cheaper. This is determined partly by the intensity of use and by the high resale value (I assume 30% residual value after 2 years).
Do we really need a borderless OLED display in a smartphone? What about the face recognition technology?
Having no borders means you can get a screen that is bigger than the iPhone Plus in a phone the size of an iPhone. I think users will value getting more screen in a smaller phone. I certainly would. Having OLED means it can be curved a bit and also have nicer, truer black.
Face recognition saves time and is more secure. I don’t know another way of making the experience better for something that you do 30,000 times a year.
What do you think about the Apple Watch, which seems to be—finally—on the right track?
The Apple Watch has been on the same track for 2.5 years. I don’t see any change in that trajectory.
Since the iPhone launched 10 years ago, 1,253,000,000 units have been sold.1 Given that they don’t last forever, we can assume that only the most recent units sold are still in use. If we measure just the units sold in the last 3 years, the total is about 663 million. Rounding down, we can say that there are perhaps 650 million iPhones in use.
Repeating the exercise for the iPad but extending time in use to 4.5 years, gives a population or install base of about 240 million.
That’s a total base of 890 iOS million units, well below the 1 billion total “active devices” Apple reported in January 2016. The difference can be filled by Apple Watch, Apple TV, iPods and Macs.
Apple also reports that the iPhones get unlocked 80 times per day. That figure was also reported in early 2016. We don’t have a figure for the iPad but I’m going to take a guess of 15 unlocks per day on average. Feel free to argue about these figures in the comments below.
Now, if each of these iOS devices would be unlocked using a 4-digit PIN, the time to bring them into use would be about 2 seconds. Expanding to a 6-digit PIN would probably increase that to perhaps 2.5 seconds (accounting also for failures due to input errors.)
Moving to 6 digits, although more secure, would add friction and hence time to the unlock process. This reminds me of the story of Steve Jobs arguing that decreasing boot times for the Macintosh would save lives. I wondered what would be the savings in time for speeding up the unlock process.
It turns out that, based on the installed base numbers, moving to the more secure 6-digit code would add 2.8 billion hours to the total time to unlock the world’s iPhones and iPads. That’s 321,000 years of waiting added for every year of use.
Fortunately we got Touch ID to replace PIN entry and the time to unlock the iPhone/iPad has decreased to perhaps 1 second, saving 5.6 billion hours of unlock time vs. 4-digit PIN.
Now we have the prospect of Face ID which promises to be faster still. Of course, it won’t be available on all iOS devices for some time, but if it that base of 890 million iOS devices were to migrate to Face ID and if it took a mere 0.5 seconds to unlock, Face ID would save nearly 8.5 billion hours of time that otherwise would be spent typing unlock codes.2
That’s almost a million years.
That’s 12,500 lifetimes.
I’m glad to see Steve’s ideas continue to motivate Apple engineers.
Apple is now the biggest watchmaker in the world, overtaking Rolex during the last quarter. This achievement happened less than two and a half years after Apple entered the watch market. Rolex, on the other hand, was founded in 1905, 112 years ago at a time when watches were the avant-garde of technology. Given this revelation of sales, we can test the estimates I put forward on the Apple Watch sales, shown below:
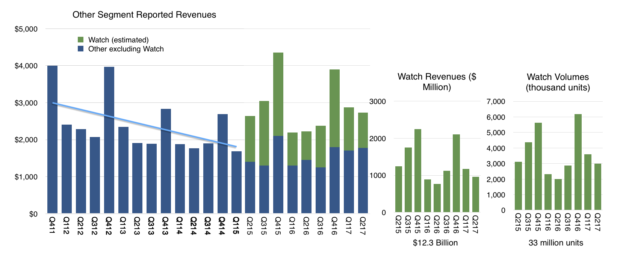
We know that Rolex produces about 1 million watches a year and we also know that Rolex had sales of $4.7 billion in 2016. The average revenue per watch1 was therefore about $4,700.
My estimate has been that Apple sold about 15 million Watches in the last 12 months at an average price of about $330. This puts the Apple Watch revenue run rate at $4.9 billion, indeed above Rolex.
They may be slightly high but the news makes me feel quite comfortable in my methodology. Note also that within the last quarter Apple said sales for the Watch increased by 50%. This is also reflected in my estimate of 3 million in Q2 vs. ~2 million for 2016 Q2.
Overall, about 33 million Apple Watch units have been sold since launch and they generated about $12 billion in sales. Coupled with a 95% customer satisfaction score, altogether, this has been a great success story. But only 2.5 years in, it’s still act one.
To understand the long term trajectory, it’s important to qualify this product as part of another, larger story. The Watch, even with LTE, is an accessory to the iPhone. It still cannot be activated without it. Even the coverage plan is an extension to an iPhone plan. The company is careful to address it as a companion product.
But how long will that last?
Continue reading “A small-screen iPod, an Internet Communicator and a Phone”
Before the iPhones 8 and X launched I made a prediction on what the iPhone would cost. I concluded that the iPhone price would not change. This is because it has never changed1. Apple collected $767,758,000,000 for the 1,203,732,000 iPhones sold to the end of June or $ 637.8147 per phone.
Of course this is the average price and that average is on a trailing 12 months basis and measures some of the deferrals in income that exist for obscure accounting reasons.
Now that the new iPhones have launched, how probable is my prediction? The first mild surprise is that the total number of phone models has increased to 16. I had no prediction on product count but did not expect the 6S and 6S Plus to remain available. The following graph shows the total number of products in the mix (excluding color variations).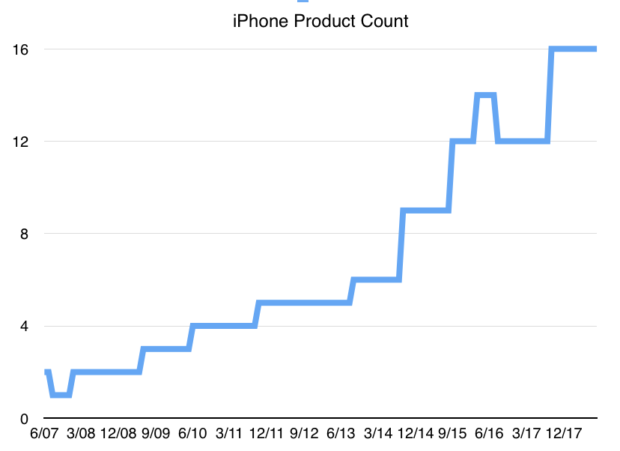
The second surprise was that the iPhone SE has been upgraded in memory from 16Gb/64Gb to 32/128Gb and that the new 32Gb version is $50 cheaper than the old 16Gb. The 128Gb remains priced the same as its 64Gb predecessor.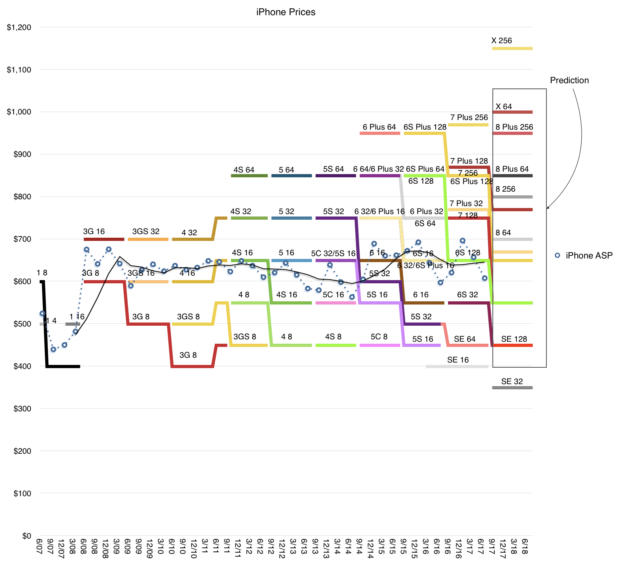
This means that the SE 32 now occupies a new lowest price band for iPhone: $350. It’s a remarkably capable phone at the lowest price for an iPhone ever. It’s $100 cheaper than the 5C 8 Gb which I bought 3 years ago.
At this point my prediction looks precarious. Continue reading “Good, Better, Best”
The answer, regardless of when you ask, is: The same as the current iPhone.
Of course, this is the answer to the question of what will the average new iPhone cost. The average selling price (which combines the revenues and the volumes of all units sold and is reported every quarter) has not varied very much since early 2008. To the degree that there is variance (between $600 and $700) it is due mostly to seasonality and reflects a mix of more expensive units during the launch quarters and a cheaper units during later periods when the product is older and due for an update.
The graph below shows the average selling price as a dashed line and the corresponding prices of individual product variants available for sale in the US during the same time frame.1
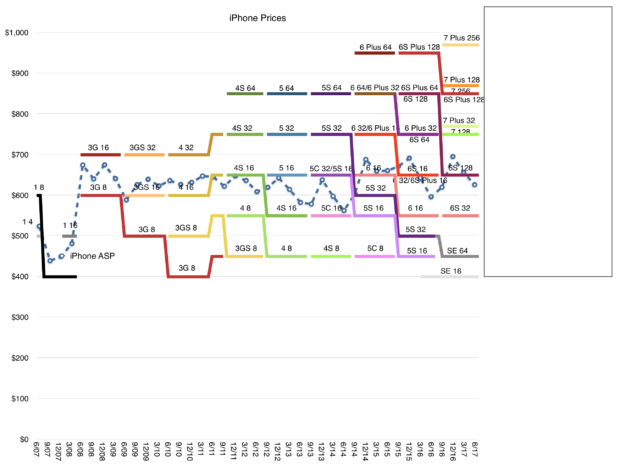
The graph shows a high degree of consistency of pattern: Every year a new iPhone is launched which replaces the one launched the year before. The older product is still offered at a reduced price. Price brackets are very firm and set at fixed intervals about $100 apart.
A few minor changes in pattern over the years can be observed:
The overall pattern looks like a staircase with a widening price range where the lowest price remains constant and the upper price rises every three years by $100.
The “floor” of the range is a consistent $400 while the “ceiling” has expanded from $700 to about $950.
This year’s ceiling is due for the fourth leg up and if the pattern persists, we should expect it to reach $1100.
This iPhone staircase has been built over 10 years and I don’t see it changing over the next three. I therefore drew the blank box over what I thought would be the price range from now until late 2020.
This is what I call the staircase model of Apple pricing. The staircase model must be understood in combination with the flat iPhone average price as the product matures.
As the product matures the user base grows (to nearly 1 billion today). Later buyers will opt for the lower price points, but the availability of higher, more aspirational models (sustained by the brand) means that a minority will gravitate upward, mainly because they can. This ensures that although the median and mode of the price trend downward, the average price stays the same.
The flatness of iPhone pricing is also to be understood in combination with the flatness of Mac, iPod and iPad average pricing (shown below)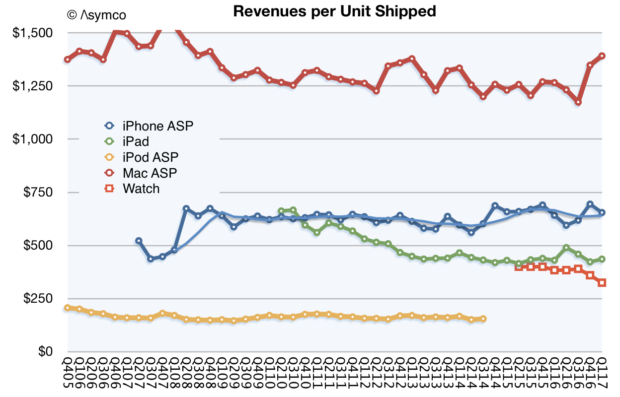
The technique of preservation of average price seems to be in effect across Apple. In other words, the evidence suggests that Apple prefers to keep average pricing for all products constant. Individual variants are priced so that, as the category matures, the changing mix leads to consistency in price ownership.
Thus the iPhone can be seen as controlling the $650 point, the Mac $1200, the iPod $200 and the iPad $450. This pricing signals the product’s value and the value of the brand.
The signaling is not just to buyers but also to competitors. Ownership of price forces competitors to occupy adjacent brackets. This process begins at launch: the new Apple product is introduced in what is perceived as a premium stratum2 thus the reaction from competitors is to “undercut” it. But, as Apple climbs the price staircase, preserving the floor, it keeps competitors bunched up at the bottom. Competing in the same brackets with Apple is futile as other brands can’t sustain the perceived premium position.
The result is a remarkable consistency of average pricing which, coupled with a remarkable consistency of competitive positioning, coupled with a remarkable consistency of customer satisfaction and loyalty, leads to a remarkable predictability of cash flows and ability to invest in new product creation..
Apple is thus quite easily understood as a remarkably consistent consumer products business. The only surprise that remains is how long it takes for that understanding to propagate.
Apple reports second calendar quarter results in about a week. I propose the following estimates:
Fiscal Q3 2017:
Rev ($B) 45.321
EPS ($) 1.62
iPhone (units) 41 million
iPad (units) 9.8 million
Mac (units) 4.35 million
Watch (units) 2.5 million
Services ($) 7.2 billion
Other products ($) 2.6 billion
Gross margin (%) 38.4
The revenue estimate is visualized in relation to guidance (revenue between $43.5 billion and $45.5 billion) and shown in the context of previous actual revenues below:p
The estimates are also consistent with additional guidance provided:
The estimates (and guidance) suggest modest growth of 7% in revenues and 13.7% EPS. The predictability of the quarter suggests that attention will mostly be focused on guidance for the next quarter.
Expectations can vary quite a bit because of the effects of a new launch. The product mix, pricing and timing are all unknown at this time.
What is known however is that the customer base for Apple is increasing and loyalty is higher than ever. What I sense, coming from very few data points, is that there are more iPhones in use than ever before. A few years ago when the market was less saturated it was easy to assume that commodity Android phones and tablets would surge and swamp iPhone/iOS usage.
This has not happened, indeed the data suggests that iOS usage is stronger than ever and that there are many more “switchers” moving from Android to iOS than vice-versa.
This may surprise some but if we look at the PC market, a similar phenomenon has been taking place for years. Mac usage grows and Macs are more visible and valuable than PCs.
It’s important to note that in the latter, post saturation stages, the markets for both phones and computers are increasingly driven by brand value. This resistance to commoditization is due to buyers’ perceptions of quality moving beyond utility and of the prioritization by buyers of new measures of performance. These new measures defy measurement.
Much of what is therefore required of market analysts is intuition.
From the way Apple reports its revenues you might think that the company has several operating segments. There are the iPhone, the Mac, the iPad for which units and revenues are reported. Then there are Services and Other Products for which we have revenues only.
Services is a collection of all non-hardware revenues and is (finally) being recognized as a non-trivial business. With reported revenues of $26.6 billion in the last twelve months, it’s big enough to be a Fortune 100 company and set to double in four years.1
That leaves “Other Products” which now becomes the revenue segment that is “most likely to be ignored.” This segment had revenues of only about $11.5 billion in the last 12 months which would place it at only a Fortune 245 ranking, equivalent to a Toys “R” Us or Biogen. How should we value Other Products?
Other includes many hardware products including iPod, Apple TV, Beats, Apple Watch, AirPods and, soon, HomePod. Each is a significant product, with Watch probably the largest single contributor. But since we don’t have specific unit numbers, we are left guessing at the contribution of each.
The Watch itself has been a point of scrutiny as it could be initially teased out of the mix through an observation of the before-and-after launch vs. trend-line as shown below:
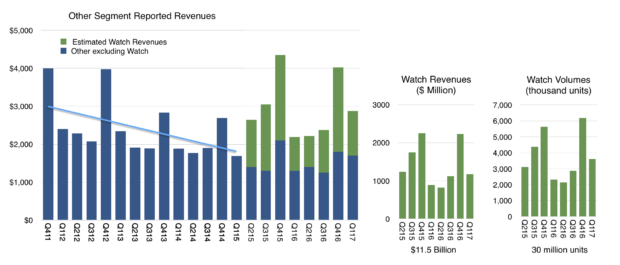
This separation of Watch became harder to discern after the launch of AirPods. Though they are still very hard to obtain, they might be “moving the needle” by now with a contribution that would muddy the Other category further. Same with updated Beats headphones.
Continue reading “Other Products”
I’m Happy to announce that I’ll be hosting the Micromobility Summit at Techfestival this year. Taking place on September 6 in Copenhagen, the one-day summit explores how new technologies affect society, cities and urbanization in the very near future.
Join and contribute here:
About Techfestival:
This September, Copenhagen will be home to 15,000+ people exploring a new, progressive agenda on technology. One week filled with 100+ conferences, summits, dinners, art installations and concerts, Techfestival’s goal is to break down today’s most complex questions into real talk and tangible experiences.f
Horace and Carolina Milanese discuss WWDC 2017 minutes after the Keynote and Hands-on with the new products.
Source: 5by5 | The Critical Path #201: Like a Costco Pickle Jar