App Story

The App Store is almost 9 years old. In that time it has generated about $100 billion in revenues, of which about $70 billion has been passed on to developers and $30 billion was kept by Apple. It’s very likely that running the App Store for 9 years did not cost $30 billion so, if it were an independent “business unit” it would probably have been and still be quite profitable.

But Apple does not run “business units” with separate Profit and Loss statements. The App Store is a part of Services which is an amalgamation of non-hardware sources of revenues but that does not mean it’s a business. The purpose of Services isn’t to turn a profit or define its value through some metric of financial performance.

The purpose of Services is to make the experience for the Apple user better. The combination of good experiences allows Apple to be perceived as a valuable brand and that allows it to obtain consistently above-average profitability through pricing power. I like to emphasize that the iPhone at over $600 in average price is more than twice the average price of all the other smartphones and captures over 90% of all available profits.

This is something that remains after a decade and indeed the price is rising in the face of overall price erosion, all without a decrease in volumes. The sustainability of this exceptionalism is due to no one single thing. It’s due to the persistence across all the things Apple does: product, stores, software and services and many other details too numerous to count.

The result is a large and expanding base of satisfied customers and a large and expanding base of partners both in hardware and software and services. The WWDC event this year showed how the ecosystem of Apple is booming with over 3 million new developers and Keynote screenfuls of partnerships. All this makes for a complex picture but it’s a real picture.

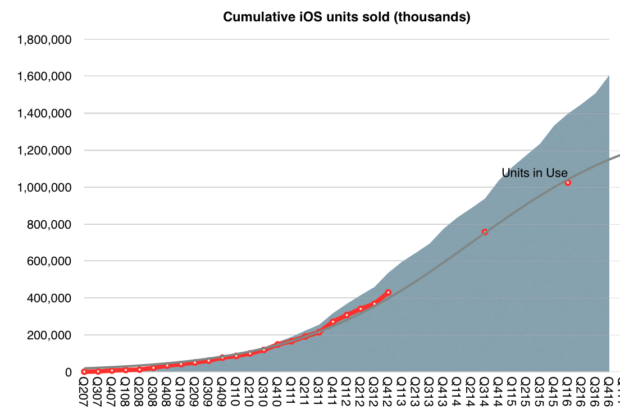
The latest numbers on Services try to tell this story: 180 billion App downloads from 500 million App store weekly visitors. The download rate is accelerating as shown in the following graph:

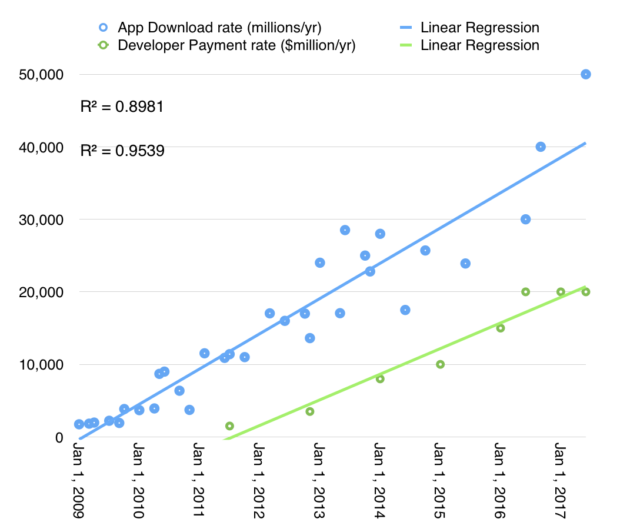
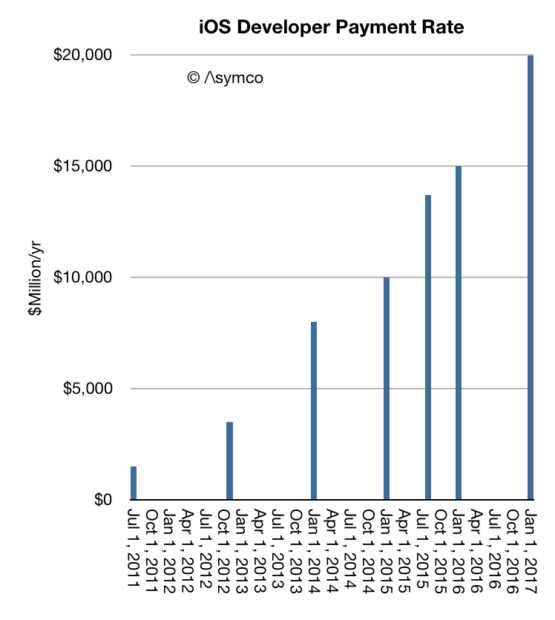
The revenue or payment rates can also be shown as accelerating though at a different rate. In both cases, the story of apps is not yet over, regardless of commentary to the contrary. Much of this growth comes from new markets like China and as India joins the iOS world, there is yet more opportunity emerging.

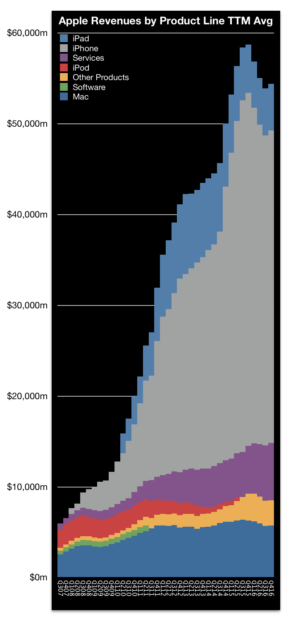
This enables part of the story of Services which can be tracked with several other metrics: reported revenues, iCloud accounts, active devices, and iTunes accounts are highly correlated.

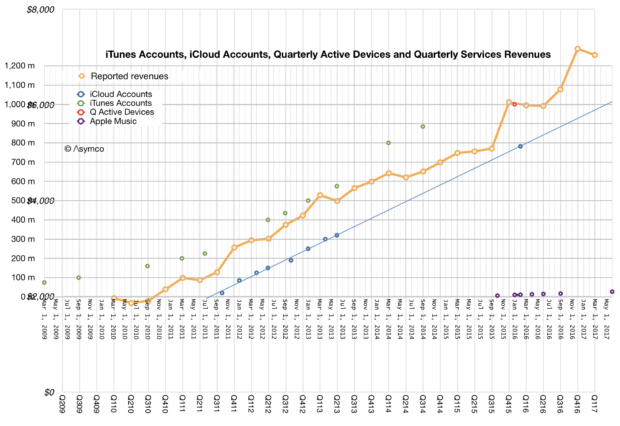
The patterns after a decade are remarkably consistent. One would have thought that with mobile saturation in advanced markets, the content story would be told through horizontal lines. What we still see is the same slopes we’ve seen since the earliest days.

But the biggest story at WWDC was the re-design of the App Store as a curated content market. The changes are profound: discovery, curation and the surfacing of content have been revamped. It’s hard to predict the implications of this but one of the indications of direction was the separation of “Games” from “Apps”. This is a jarring idea since if all Apps are content, what makes Games different from other Apps? Is this a genre elevated to a new medium?

I can’t yet get a sense of where this is heading, if anywhere, but the remarkable story of Apps is that it’s still an ongoing story. We may be on chapter 2 and we can’t predict how many chapters remain.

Keep an eye on Apps and Services and developers. They are not lagging indicators of success for Apple. They are very much leading.

Predictably Profitable, Unpredictably Valuable

Predicting Apple’s yearly revenues has been fairly easy. The following graph shows the relationship between budgeted spending on Machinery, Equipment, Internal-use software, Land & Buildings and the shipment of iOS device revenues.

The company conveniently publishes a full-year forecast of these expenditures every fiscal year so by October we know roughly how sales will be during the following year. This pattern has held for 10 years so there is little uncertainty about the 11th year of iOS devices.

Continue reading “Predictably Profitable, Unpredictably Valuable”

Predicting The Second Quarter

The last quarter of 2016 was Apple’s biggest ever. $78.4 billion in revenues. 78.3 million iPhones. Both records. Earnings of $3.361 and cash reached new highs. The growth was modest but Services is now not just the second largest revenue but also the fastest growing, on track to doubling in four years.

The reason for this is the vastness of Apple’s user base coupled with the loyalty the brand engenders. The company reached one billion active devices more than a year ago and is quite likely to have nearly a billion users. Not just any billion either–the best billion most probably.

The realization that Apple benefits from extreme quantity and quality of customers has led some observers to defer the imminence of Apple’s demise. Share prices have risen lately to new highs and the ratios between these prices and earnings have started to come closer to the average of other large companies.

But enough with the reductio ad absurdum. Let’s look at the next quarter. The company has been very precise with its own offered predictions (guidance) so it’s a simple task to make an accurate forecast. The history of guidance vs. outcomes for revenues is shown below:

Placing the pipper on the upper edge of the guidance range was a safe targeting method for 11 of the last 17 quarters. We have never seen a drop below the bottom of the range but had a few overshoots, some huge. Doing this for the latest quarter and working backwards to the individual product contributions to revenue and using historical margin and cost patterns we can get the following core financial performance metrics:

Fiscal Q2 2017:
Rev ($B) 53.4
EPS ($/share) 1.96
iPhone (thousand units) 53100
iPad (thousand units) 9900
Mac (thousand units) 4100
Watch (thousand units) 2300
Services ($ million) 7129
Other products ($ million) 2300
Gross margin (%) 37.8

I sent these estimates to Philip-Elmer DeWitt and I recommend looking at his survey of the other analyst estimates on his excellent Apple 3.0 blog.

Overall, the quarter is shaping up to offer slight growth y/y and indicating a plateau formed after the surge from the iPhone 6 surge in ’15. All eyes are on the “super cycle” for the next iPhone.

The reason it’s “super” is that the iPhone has a 2+ year cadence for form factor changes and the user base updates on a similar cycle. The demand is vast due to the user base and accumulated age of devices in use. Expectations are that supply will be offered to meet this demand.

If history is a guide then the next iPhone will be the best iPhone ever.


  1. On shares priced at the time around $105 or 3.2% yield quarterly earnings []

Contact Less

In September 2016 Apple Pay came to support the world’s largest public transit system. It happened through the integration with Japan’s FeliCa and gave Apple Pay access to 160 million daily transactions.

This, along with many other milestones don’t get a lot of attention. Apple Pay is in what could be considered an attritional competition with non-consumption. There are no decisive battles won or lost, only the relentless pressure to make progress against a reluctance to change.

Before I go on, I should make the attrition/decisive type of conflict clear. The terms come from military science. A war of attrition is one where two sides essentially grind against each other and the winner is the one which lasts longest. A decisive battle is one where a conflict is won through a single, acute encounter where, due to either demoralizing or circumstance reasons, one side gives up. It’s the knock-out punch vs. the fight to exhaustion.

When applying this dichotomy to competition, we need to be careful about who we define as competitors. Note that I said that Apple Pay is in a fight with non-consumption. It’s tempting to say Apple Pay competes with some other payment system like Samsung Pay or Google Pay. But none of these alternatives are as powerful as the existing mix of contact payment systems: cash, credit card magnetic swiping and some other hybrid of codes and user experiences (especially online.)

When seen this way the challenger must compete through persistence. It’s impossible for Apple Pay to decisively defeat non-consumption in one battle. It takes literally millions of decisions for adoption: each consumer, each merchant, each bank, each point of sale. It’s a relentless grind of pitching, selling, demonstrating and shaming into action.

It’s been three years of this type of competition and progress may seem hard to spot. That is because we don’t see the big wins. We can only see small wins. The win in Japan, as significant as it might be (160 million daily transactions added to the addressable market) is still small compared to all transactions world-wide.

Continue reading “Contact Less”

iPad Optics

The iPad has an installed base of over 300 million. This is a far larger audience than that of the Mac (which has somewhere between 100 million and 150 million). And whereas the iPad acquired this audience in about 7 years, the Mac took 33 years.

Curiously however, it is the iPad that is seen as the more fragile product. The iPad is considered to be failing, with a presumption of an end of life in the near future. The evidence of this failure the year-on-year decline in units sold. This is illustrated by the following graph. Screen Shot 2017-03-23 at 10.05.21 PM

Note that the iPad decline is paired with a steady increase in the Mac. The iPad exhibits a four year decrease in overall volumes. This has, as they say, bad optics.

But what is seen isn’t all that might be,

If we look further we see that the iPad is still a much loved and much used product. Data from the Pew Internet Survey shows that tablet ownership among US adults increased from 45% in April 2015 to 48% in April 2016 and 51% in November 2016. The rise has been steady. Although this counts tablets, the iPad had 85% share of the U.S. market for tablets priced above $200 so it’s a fair assumption that the iPad audience is growing. Similar data exists for the UK.

Screen Shot 2017-03-23 at 10.11.50 PM

In addition, user satisfaction with the product continues to be very high. Apple cited that in November, 451 Research measured a 94% consumer satisfaction rate for iPad Mini, a 97% rate for iPad Air, and 96% for iPad Pro. Finally, browsing, shopping and app usage data also show continuing high utilization for iPads.

Furthermore, iPads are still growing in “non-consuming” markets. iPad posted double-digit growth in both Mainland China and India, it continues to attract a very high percentage of first-time tablet buyers.

Finally, within corporate buyers there is a 96% satisfaction rate with 66% purchase intent. Apps and solutions are continually being developed for the platform.

Taking into account that the iPad has a large, stable, engaged and loyal user base that continues to expand and find new uses the optically bad sales data needs an explanation. The simplest explanation is probably the best: iPads remain in use far longer than phones, and perhaps even longer than some computers.

Anecdotally we can see evidence for this. Few iPads are replaced every two years the way phones are. They are not tied to service contracts or subsidized. They are also less likely to be damaged during usage as phones are dropped and banged-up. iPads are more stationary or carried in protected containers. Phones are in pockets, iPads are in bags.

So iPads are longer-lived products and it’s perfectly reasonable that people who have them keep using them and more people are joining them but slowly. Note also that the decline in sales seems to be flattening out and perhaps might show stabilization.

Further countering of the iPad in decline idea is the continual improvement in the product. The latest is a refresh of the iPad with more battery life, a better screen and support for Pencil.

Perhaps the iPad will not return to rapid growth, or perhaps it will. But the more likely possibility is that the iPad will level out maintaining steady levels and, perhaps, grow slightly. This flat rather than up/down trajectory is unusual in devices but it isn’t when you look at the Mac. And isn’t the goal of the iPad to become a computer?  If so then perhaps Mission Accomplished.


Gravity

Apple is doomed. So are you. As mortals we are used to the idea of death. We do not dwell on it even though it’s inevitable. We do know that we’ll die but what we don’t know is when we’ll die. That certainty/uncertainty makes us, more or less, do everything that we do. And so we carry on. But companies die too. And when they die is also a mystery but it’s not at all clear that their inevitable demise determines what they do. If you think you’re immortal you may live dangerously. Perhaps as a result they live shorter lives than we do.

Life expectancy for humans has been rising but for companies it has been declining. Even more curiously, the richer you are the more likely you are to live longer but the wealthier a company, the more likely it is to keel over at any time. The longest lived small businesses live over 1000 years but the longest-lived large business is probably the East India Company that made it to the ripe age of 274. But that was before 1800.

In the modern, industrial era there are very few corporations that survived over a century and the Fortune 500 shows a turnover in inhabitants that resembles that of a plague-infested medieval inner-city. In contrast to their conservative, geriatric organic owners, synthetic companies are more likely to behave like live-fast, die-young punk rockers.

So it’s no surprise that Apple, at age 40, is seen as being well past its sell-by date. And yet it seems to be saying, somewhat faintly, “I’m not dead yet”. By generating more cash than can be comprehended by human observers and by controlling assets that are well beyond the means of many countries, they (it?) is confusing us with its persistence.

The confusion is exhibited in the following graph which shows the crises in confidence by that wonderful reflector of human perception–the stock market. By voting millions of times a day, the market shows us with great precision the totality of human emotion with regard to an asset. That emotion turns rapidly negative on Apple with surprising frequency.

Screen Shot 2017-03-16 at 2.32.03 PM

There have been over 8 bouts of collapsing confidence (exhibited by 40% drops in value) for Apple’s shares. Consider the latest where we’ve seen a 40% drop followed by 57% increase in share price over the last 12 months. 57% might not seem extraordinary for a small company but for the world’s largest market capitalization with the corresponding colossus of cash that it straddles, the robustness of brand and the loyalty of customers, the mind boggles.

The same thing happened in 2012 and 2008 and as far as I can tell the company has not changed one iota during that time. The same people, mostly, are in charge. With the same mission statement, and even the same product line. The resources, processes and priorities–the only determinants of the essential value of a firm–have not shifted.

One could try to suggest that even if Apple is unchanged, the world around it has changed. But if anything the world has come to match Apple’s own view: more mobile vs. fixed, more design vs. generic, more integrated experiences vs. more modular DIY.

The ethos of Apple is rigid so why is perception about the company so fickle?

If the graph above reflects perception about a constant entity then perhaps it charts how the world has changed rather than how Apple has. Perhaps perception revolves around a center of gravity far heavier and permanent. Perhaps the tug-of-war between fear and greed reflects more upon us that it does upon the object being observed.

The First Trillion Dollars is Always the Hardest

In its first 10 years, the iPhone will have sold at least 1.2 billion units,1 making it the most successful product of all time. The iPhone also enabled the iOS empire which includes the iPod touch, the iPad, the Apple Watch and Apple TV whose combined total unit sales will reach 1.75 billion units over 10 years. This total is likely to top 2 billion units by the end of 2018.

Screen Shot 2017-01-11 at 10.15.00 PM

The revenues from iOS product sales will reach $980 billion by middle of this year. In addition to hardware Apple also books iOS services revenues (including content) which have totaled more than $100 billion to date.

This means that iOS will have generated over $1 trillion in revenues for Apple sometime this year.

In addition, developers building apps for iOS have been paid $60 billion. The rate of payments has now reached $20 billion/yr.

screen-shot-2017-01-11-at-9-41-29-pm

Not included in this payment total are “mobile-first” or “mobile mainly” businesses such as FaceBook, Twitter, Linkedin, Tencent, YouTube, Yahoo, NetEase, Pandora Radio, Google Search, Baidu, Google Maps, Gmail, Instagram, Amazon, eBay, JD.com, Alibaba, Priceline, Expedia, Salesforce and Other Enterprise Software, Ride Sharing Apps, AirBnB and many other services which monetize independently of the App Store.

I estimate that the cumulative revenues enabled by iOS across these businesses have exceeded $500 billion, with a rate of revenue soon to reach $300 billion/yr.

The revenue numbers can only hint at the change in behavior among users. An iPhone is unlocked 80 times a day. Assuming 600 million devices in use there are 48 billion sessions on iPhones every day. 17.5 trillion sessions every year. It is these instances of interaction and engagement which are desired by all businesses built on top of the ecosystem.

These instances of engagement must be multiplied by the quality of the customers which Apple captures. iOS users spend more and are more loyal than those on alternative platform thus qualifying the platform as “premium” and thus adding to its value in the eyes of developers, content producers and service providers.

As the install base of iOS increases and as users hire the devices to do more and spend more time with them the virtuous cycle of value creation will continue and accelerate.

There is a temptation to think that such a business is fragile and will be disrupted. Challengers appear daily and the number of iPhone “killers” is not measurable. One can cite the billion users of Nokia phones which defected. One can cite the loyalty of BlackBerry users that evaporated. One can even cite the juggernaut of Windows and how it became impotent. One can cite the vast number of Android devices offered at low prices.

But there are reasons to believe that the iOS empire is far stronger and resilient.

Unlike Nokia’s phones, Apple’s product is an ecosystem with network effects and dependencies on software and services. It’s also a monolithic product with a singular interface and form factor.

Unlike BlackBerry, the iPhone does many jobs–too many to count. Indeed the iPhone evolves and changes its core value over time.

Although different in many ways from Windows there are strong similarities in terms of loyalty and persistence of users. iOS even developed a dominant position in enterprises. Microsoft’s attempt to become a hardware company is a testament to the confluence of the two business models.

And whereas Android was originally seen as the “good enough” iPhone, potentially disrupting it, it turns out to be the ersatz iPhone. Chances are higher that users will switch from Android to iPhone and not the other way. Again, the reasons have more to do with the ecosystem and quality of users (which are hard to measure) than with the hardware (which is easy to measure.)

As we look toward the second decade of the iPhone, the expectation isn’t one of another “big bang” but a process of continuous improvement. The market is nearing saturation so the goals must be to capture more switchers from Android. Apple has achieved this with the Mac: survival, persistence and eventual redemption.

More exciting is the apparent expansion of a network of ancillary “smart” accessories. The Apple Watch, the AirPods, Pencil and possible new wearables point toward a future where the iPhone is a hub to a mesh of personal devices. The seamless integration of such devices is what has always set Apple apart.


  1. Includes forecast for first six months of 2017 []

Wherefore art thou Macintosh?

Managing the Mac product line must be one of the most challenging problems at Apple. That may not be obvious given the product’s success. Consider what it has achieved:

  • The product is in its 32nd year of market presence. A longevity that in unmatched by any other PC maker.
  • Apple reached a top five position in the ranking of PC vendors. This was achieved for the first time only this year, far along in the evolution of the market.
  • With about $23 billion in revenues per year, Apple places among the top four PC vendors in terms of revenue.
  • With an estimated $5.5 billion in operating margin Apple is the most profitable PC vendor, capturing over 60% of the available PC hardware profits.
  • The product has retained an average selling price of over $1200 for at least a decade. At the same time the average pricing of Personal Computers has more than halved.
  • Although volumes have fallen for three quarters, the product grew volumes and sales for 22 out of 29 quarters. As a result, volumes almost doubled in eight years.1

The contribution of the Mac to Apple’s revenues is shown in the following graph.

screen-shot-2016-11-02-at-2-22-23-pm

It’s attractive and convenient to contrast the Mac with the rest of the PC industry. A David vs. Goliath tale of redemption. The classic comeback story. But the split between the two old rivals (Windows/MacOS) focuses the mind into a limited view of the computing market. The big change in computing has not been a growing Mac vs. declining PC. It has been a huge surge in mobile device use vs. a decline in PC use overall.

This data is visible in many ways. Browsing data shows mobile overtook PC use this year. Shopping data around Black Friday points in the same direction. Data on user interaction captured by comScore is shown below2

screen-shot-2016-11-02-at-3-45-49-pm

PC use went from half to a third of time while mobile went the other way: from a third to half of time within only four years. All the data is consistent: mobile use has swept PC use aside.

Continue reading “Wherefore art thou Macintosh?”

  1. The unit volumes in third quarter 2008 were 2.6 million. Eight years later they are 4.9 million and could easily be over 5 million in the holiday quarter. []
  2. Although US only, the global picture is likely to be even more skewed toward mobile as PC didn’t saturated global markets before the smartphone swept to power. []

Mini Me

Horace and Henri go for a drive.

The Critical Path is sponsored by Wealthfront, the automated investment service that makes it easy to invest your money the right way. Get your first $15,000 managed for free when you visit Wealthfront.com/5by5.

Support also comes from Braintree, code for easy online payments. If you’re building a mobile app and searching for a simple payments solution, check out BraintreePayments.com/criticalpath.

Source: The Critical Path #186