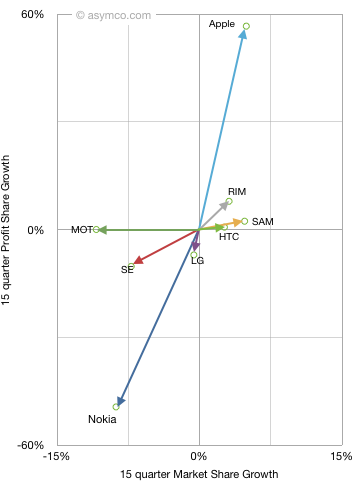
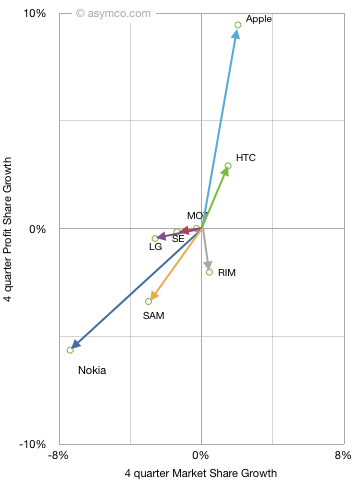
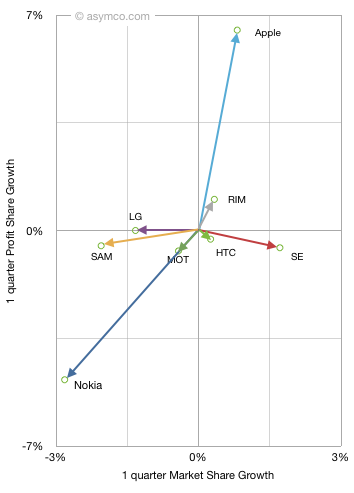
Last fall I introduced the “vector space” model of visualizing vendor performance. It shows performance along two dimensions: market share growth vs. profit share growth for a set of competitors.
When introduced, I chose a long time frame (15 quarters) to see the long-term pattern. This quarter I add two more time frames: year-on-year and sequential. This allows a view of how market change is itself changing. The three diagrams are shown below (note difference in scales)
One way to interpret this is movement toward the upper right is positive while movement down or to the left is negative. A deeper meaning can be obtained from noting that the vector sum or “net” of vertical and horizontal data points should be zero (i.e. the gains in share should be at the expense of losses in share). In terms of phone market share the “net” is not zero as “others” are excluded, but the difference is visually not perceivable.
Since we’re dealing with share, one way to interpret the data is that “improvement” in one’s position is offset by the “decline” in another’s. We cannot ascribe the benefit of a vendor directly to the loss of another but overall net gainers are offset by net losers.
By tracking this position change over time we can see if there is a set of consistent winners and a set of consistent losers. The pattern does show that:
- Smartphone vendors grow consistently
- Apple in particular has consistent growth with profit growth faster than share growth
- Nokia in particular has consistent decline with profit decline faster than share decline
- RIM shows profitability concern in the near term. In particular vs. HTC
- Samsung shows some near term share loss, probably due to unbranded vendors
- It’s very rare to have a company lose market share while gaining profit share or to gain market share and lose profit share. This implies that in this market one does not trade off volume for profit.
The correlation between profit and volume growth is very telling. As is the consistent clustering of winners and losers. This analysis demonstrates the shift in the industry is not a short term phenomenon but a disruptive changing of the guard. If history is any guide, this change is not going to be undone.
Discover more from Asymco
Subscribe to get the latest posts sent to your email.


