Measurements of “share” are abundant. There is journalistic value in summarizing performance in a single figure of “share” but it usually is a very limiting view. For example in the global mobile phone market there are at least the following measurements available:
- Share of all handset units sold
- Share of installed based of handsets (penetration)
- Share of smartphones
- Share of mobile computers
- Share of value (revenues) captured
- Share of profits
- Share of platforms
- Share within a given platform
- Share by regions/countries/geographies/demographics
One could go on. So performance in a market can only be measured if you know to what end is that measure applied. Are you trying to determine current performance or are you assuming that the future will be different and trying to figure out what that future will look like?
There is no good answer. It depends. But at least we can combine more than one share value into a summary. Mark Hernandez suggested that I put forward a “composite index” to measure vendor performance. I am willing to give it a try. The first iteration can be an unweighted average of four “shares”:
- Share of all handset units sold (global)
- Share of smartphones
- Share of value (revenues)
- Share of profits
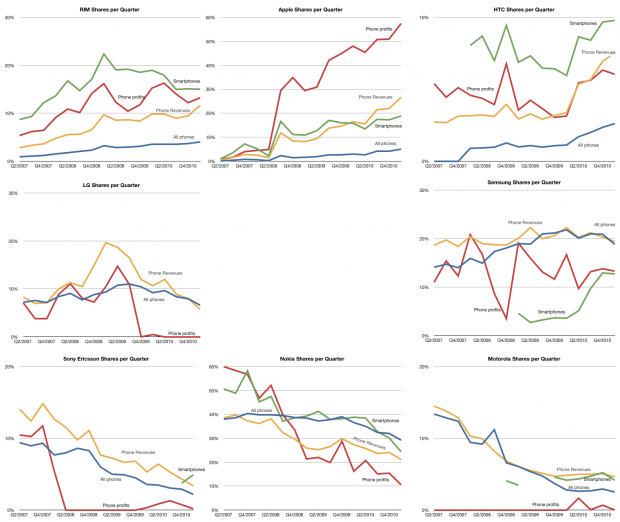
The raw data for each share is shown in the following charts (note change of vertical scale: each gridline represents 10%).
Note that the vendors are arranged in a particular way: top row are entrants, bottom row are incumbents with late incumbents from Korea arranged in the middle.
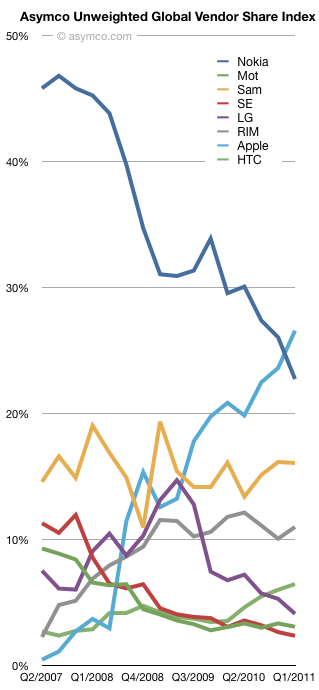
Taking the average of each of the lines above, the unweighted share index (Units, Smartphones, Value and Profit) is shown below:
Over the time period since Apple’s entry in the market, the index shows interesting patterns:
- Apple and Nokia trading places
- Relative stability for Samsung
- A leveling off for RIM
- The Peaking for LG
- Very tightly coupled declines for Motorola and Sony Ericsson
- Gradual improvement in HTC
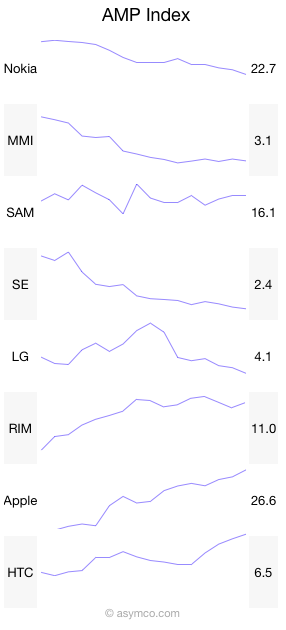
And here it is in sparklines:
Like many indices, this is a generalization that measures a section of reality. The value is in its use as a benchmark. If nothing else, it has journalistic value. I’m open to suggestions on how to improve it. Perhaps some form of weighting would be useful. Also, if anyone can suggest good name for it, it might be easier to communicate.
Discover more from Asymco
Subscribe to get the latest posts sent to your email.


