[Updated with Mac OS versions. See footnote 3.]
I’m glad Windows 8 is named the way it is. With Windows 7 Microsoft went to a numbering system which is much more rational than the mixed naming of the past. The number 8 actually corresponds to the actual sequential number of major versions of Windows released to date.
Windows proper actually did not start with what was called “Windows 1.0”. Windows actually started in April 1992 when Windows 3.1 was released. It was the first Windows which was an operating environment onto itself, apart from DOS. It was followed by Windows 95 (which we can call “2”), Windows 98 (“3”), Windows 2000 (“4”), Windows XP (“5”), Windows Vista (“6”), Windows 7 and now Windows 8.
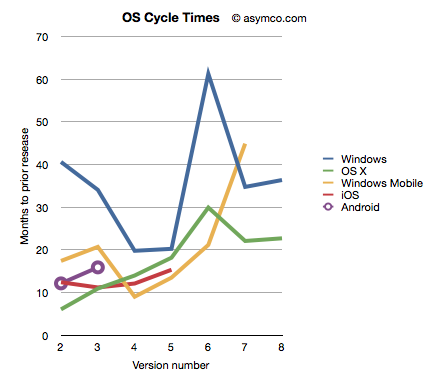
Given this nomenclature and the dates of general availability of said versions, we can derive a measure of the frequency of upgrades. For example Windows “2” followed about 41 months after “1” and “3” took 34 months after “2”. If we continue this for all the versions, and assume “8” will launch by October next year, we can plot the cycle times of new Windows versions.
To make the story more interesting I added the same data for other OS platforms. OS X, iOS and Android have version numbers which correspond to the sequential order in which they were released. I am assuming that the numbering system (1.0, 2.0, 3.0 etc.) are meaningful and that major releases are given a new integer value.[1]
I also added Windows Mobile which suffered from the same confused numbering that Windows suffered until the current Windows Phone 7. To create a map to integer values I used the following: Pocket PC 2000 is “1”, Pocket PC 2002 is “2”, WinMo 2003 is “3”, WinMo 2003 SE is “4”, WinMo 5 is “5”, WinMo 6 is “6” and Windows Phone 7 is “7”. There is no clarity when and what Windows Phone 8 will be so that is left off the chart.
The chart above does give a clue that Windows is a bit slower (more months between releases) than alternatives. However, the point I want to convey is that this cycle time can be a strategic advantage. A faster upgrade cycle means more rapid adoption of improvements, not to mention more revenues. Rather than a line chart, the better way to visualize it is as a turning circle.
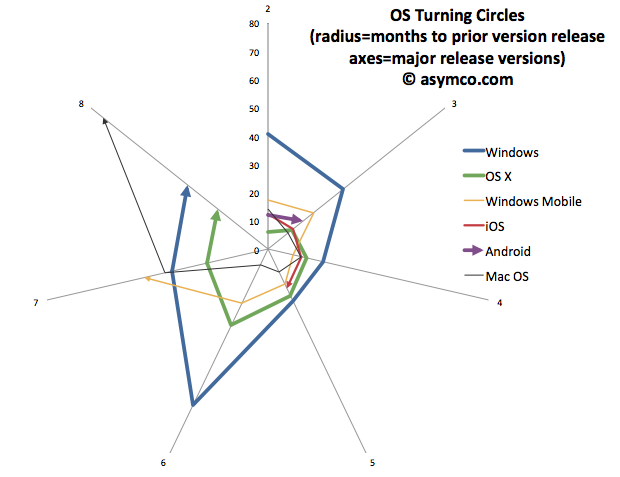
The analogy is from aerial combat where a plane that can “turn inside” an opponent can get into a firing position. The tightness of turning circles also means that a competitor can iterate more quickly and thus move up the trajectory of improvements necessary to remain competitive more rapidly. To that end, I re-plotted the data above with radial axes.
The chart clearly shows how among desktops, OS X has been tighter than Windows[3]. Furthermore, mobile OS’s have been, typically, more agile than desktop OS’s. The exception being Windows Mobile which had significant architectural and business model challenges. It will be interesting to watch the radius of Android. So far it seems to be tight, but as tablet functionality has been added, the speed of change has slowed slightly.
However, the big contrast is between mobile and desktop. Microsoft tries with Windows 8 to merge the two. But these are different ecosystems. Buyers, OEMs, users, all have different behavioral patterns (jobs-to-be-done) for mobile OS vs. desktop/portables. Will the cycle time for Windows 9 and Windows 10 tighten up? Can Microsoft operate its OS division at this new cycle time?
What is even more bad news is that the most important customers for Microsoft, enterprises, actually upgrade every other version. The Windows “radius” is nominally averaging about 35 months but large account adoption is closer to 60 months.
The contrast is then striking: Consumerized devices with over-the-air updates on a 12 month cycle are five times more agile than a traditional corporate Windows desktop. Another way to look at this is that for every change in a corporate desktop environment, the average user will change their device experience five times. Although Microsoft might find comfort in Enterprises’ leisurely pace of change[2], those are the wrong customers to keep happy going forward.
The implications are left as an exercise to the reader, but I would argue that along with the asymmetry in business model around pricing that I highlighted in the last Critical Path podcast, Microsoft has a significant operational asymmetry with devices as a new class of computers.
—
Notes:
- The dates of general availability of various versions of operating systems.
Version Windows OS X Windows Mobile iOS Android 1 4/6/92 3/24/01 4/19/00 6/29/07 10/21/08 2 8/24/95 9/25/01 10/1/01 7/11/08 10/26/09 3 6/25/98 8/24/02 6/23/03 6/17/09 2/22/11 4 2/17/00 10/24/03 3/24/04 6/21/10 5 10/25/01 4/29/05 5/9/05 10/1/11 6 11/30/06 10/26/07 2/12/07 7 10/22/09 8/28/09 11/8/10 8 11/1/12 7/20/11 - While at Nokia’s Enterprise Solutions I was witness to this difference between the cycle time of devices and the pace of adoption of Enterprises. The fundamental disconnect was that the sales cycle for a “solution” was longer than the shelf life of a device upon which that solution was predicated. Needless to say, Nokia Enterprise Solutions did not last long. Nor do we see today any significant Enterprise-focused mobile device businesses (RIM itself moved to consumerize its products years ago.)
- I added Mac OS data to the second chart to also illustrate that no company is immune from spinning out of control. Mac OS clearly went spun out after version 6 with increasing delays leading to its demise and replacement. You can also note that its replacement (OS X) was able to straighten-up and fly right. The lesson may be perhaps that ditching and starting over is a viable option.


