I began comparing Microsoft and Apple’s financial performance with a review of “top line” or revenues by product lines over a four year period.
This post is about the “bottom line” for the same companies and products.
Before I jump in I would like to make sure there is no confusion about the terms. I will be comparing “operating income”[1] as a measure of “bottom line”. This is a common way to compare the profitability of companies because it excludes taxes and interest income. These non-operating expenses/income can distort a comparison of performance because they can be the result of investment activity or changes in tax law or where the company is domiciled. One should not make judgements of comparative performance on those non-operational bases.[2]
Another challenge is that some companies report operating income by division while others don’t. We can usually compare overall operating income but usually not on a division or product-level. This is the challenge I will try to overcome in this analysis between two very different operating models.
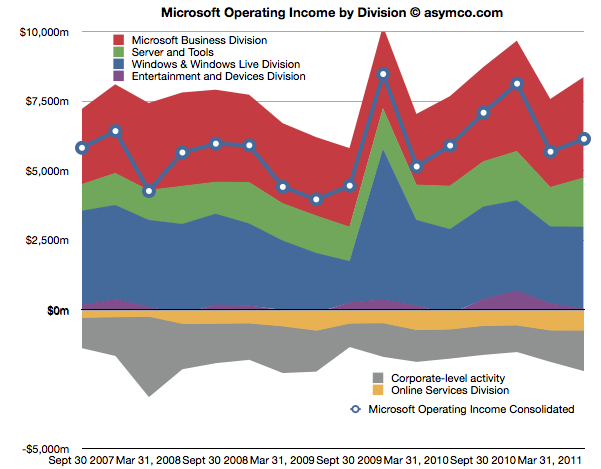
The first chart shows Microsoft’s Operating Income by Division as reported by the company.
Each area represents a business division. Note some are showing negative income (losses). Continue reading “iOS vs. Microsoft: Comparing the bottom lines”

