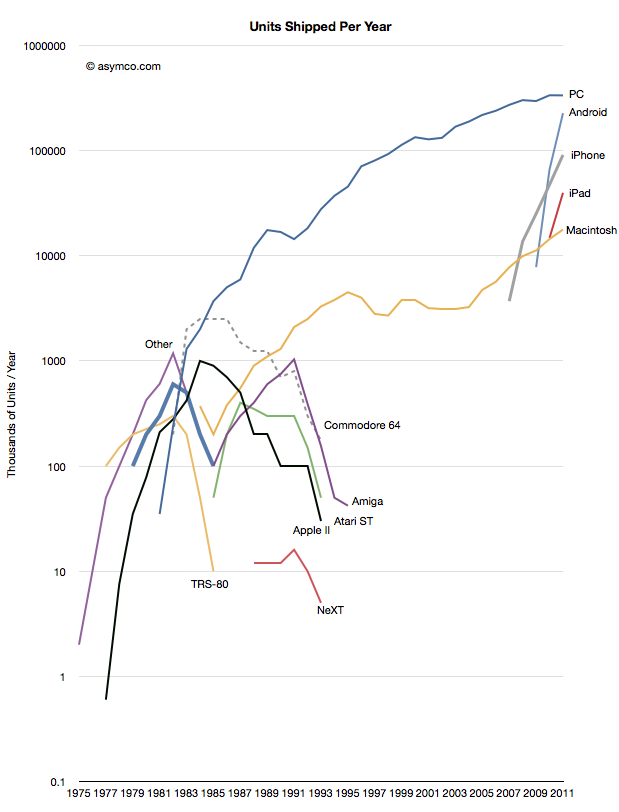
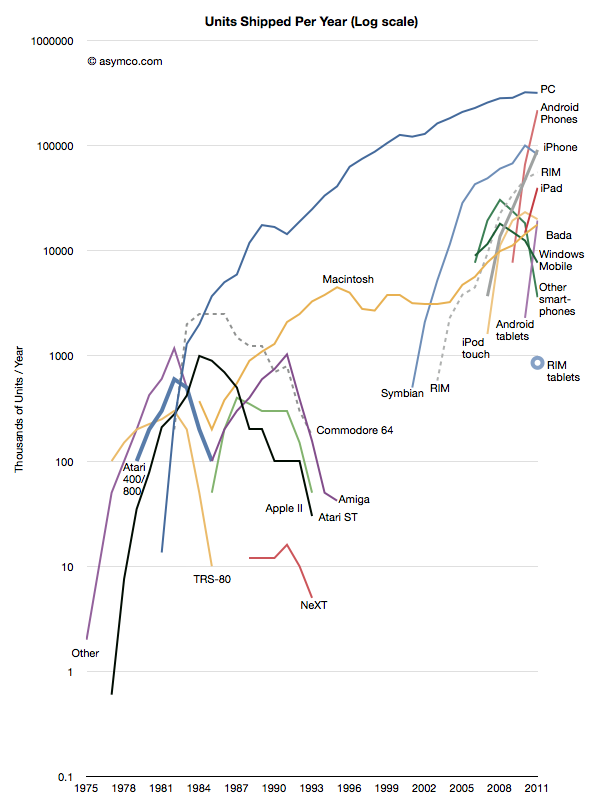
Thanks to Jeremy Reimer I was able to create the following view into the history of computer platforms.
I added data from the smartphone industry, Apple and updated the PC industry figures with those from Gartner. Note the log scale.
The same information is available as an animation in the following video (Music by Nora Tagle):
httpv://www.youtube.com/watch?v=8h-C6u4yLj4
This data combines several “categories” of products and is not complete in that not all mobile phone platforms are represented. However, the zooming out offers several possible observations into the state of the “personal computing” world as of today.
- We cannot consider the iPad as a “niche”. The absolute volume of units sold after less than two years is enough to place it within an order of magnitude of all PCs sold. We can also observe that it has a higher trajectory than the iPhone which became a disruptive force in itself. Compare these challengers to NeXT in 1991.
- The “entrants” into personal computing, the iPad, iPhone and Android, have a combined volume that is higher than the PCs sold in the same period (358 million estimated iOS+Android vs. 336 million PCs excluding Macs in 2011.) The growth rate and the scale itself combine to make the entrants impossible to ignore.
- There is a distinct grouping of platform options into three phases or eras. The first lasting from 1975 to 1991 was an era of rapid growth but also of multiple standards and experiments. It was typical of an industry in emergence. The personalization of computing brought about a new set of entrants. The second phase lasted between 1991 and 2007 and was characterized by a near monopoly of Microsoft, but, crucially one alternative platform did survive. The third phase can be seen as starting five years ago with the emergence of the iPhone and its derivatives. It has similarities to the first phase.
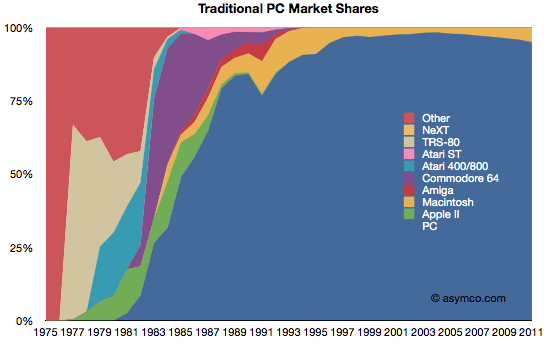
We can also look at the data through a slightly different view: market share. Share is a bit more subjective because we need to combine products in ways that are considered comparable (or competing).
First, this is a “traditionalist” view of the PC market as defined by Gartner and IDC, and excluding tablets and smartphones.
This view would imply that the PC market is not changing in any substantial way. Although the Mac platform is gaining share, there is no significant erosion in the power of the incumbent.
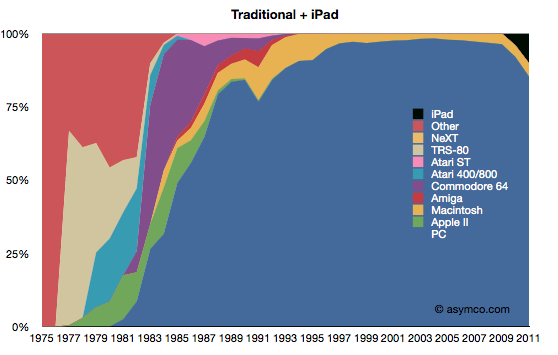
Second, is a view where the iPad is added to the traditionalist view.
This view is more alarming. Given the first chart, in order for the iPad to be significant, it would need to be “visible” for a market that already ships over 350 million units. And there it is. If counted, the iPad begins to show the first disruption in the status quo since 1991.
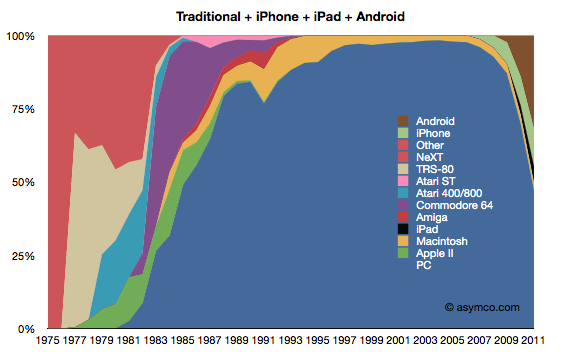
The third view is with the addition of iPhone and Android.
This last view corresponds to the data in the first graph (line chart). If iOS and Android are added as potential substitutions for personal computing, the share of PCs suddenly collapses to less than 50%. It also suggests much more collapse to come.
I will concede that this last view is extremist. It does not reflect a competition that exists in real life. However, I put this data together to show a historic pattern. Sometimes extremism is a better point of view than conservatism. Ignoring this view is very harmful as these not-good-enough computers will surely get better. A competitor that has no strategy to deal with this shift is likely to suffer the fate of those companies in the left side of the chart. Treating the first share chart as reality is surely much more dangerous than contemplating the third.
I’ve used anecdotes in the past to tell the story of the disruptive shift in the fortunes of computing incumbents and entrants. I’ve also shown how the entry of smart devices has disrupted the telecom world and caused a transfer of wealth away from the old guard.
The data shown here frames these anecdotes. The data is not the whole story but it solidifies what should be an intuition.
[Update]
Additional platforms added to the first chart.
Discover more from Asymco
Subscribe to get the latest posts sent to your email.

