I’ve been publishing my estimates for Apple’s business performance for a few quarters (see here, here and here). My estimates have been collected along with those of dozens of others by Philip Elmer-DeWitt at the Fortune Apple 2.0 blog.
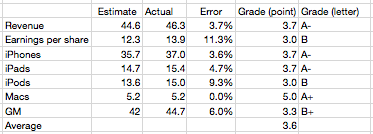
I’ve also been scoring my performance and discussing the causes of errors. Here is the analysis for the fourth quarter 2011.
My estimate for Mac growth was very precise. It was based on a 27% growth estimate. It turns out that growth was well within historic range and thus quite predictable.
iPhone and iPad error was very modest at less than 5%. This led to a very low error on Revenues (as I also did not expect ASP to change).
I was too pessimistic on the iPod, expecting 30% decline and 13.6 million units. In reality the business declined by only 21% and Apple still sold 15.3 million units at an average selling price of $164.
Due to an underestimate on margins which are highly sensitive to iPhone margins my gross margin estimate was off by 6%. This led to a relatively poor EPS error of 11%.
Nevertheless, the “grade point average” for the quarter was 3.6 which is nearly an A-. This is an improvement from the B- from the last quarter.
Because the accuracy was good, there is little to be learned from the quarter. Perhaps the most important observation is that the iPhone recovered from two outlying quarters. The second quarter where it overshot expectations and the third quarter where it undershot. These were hard to predict because the product went through a delayed transition which whip-sawed both production and sell-in.
What we saw in the fourth quarter is a return to the predictable historic growth of nearly 100%.
To give a perspective on the performance of other analysts, a motion chart showing their errors is here.
See also the video PED published of the same data here. (This video was produced from the same motion chart shown above, selecting bars instead of bubble as the chart type).
Notes:
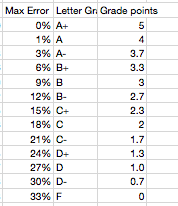
- The scoring of the error is according to the following table:

- The results can be seen for all the other analysts as a table here (with data since mid 2008).
Discover more from Asymco
Subscribe to get the latest posts sent to your email.

