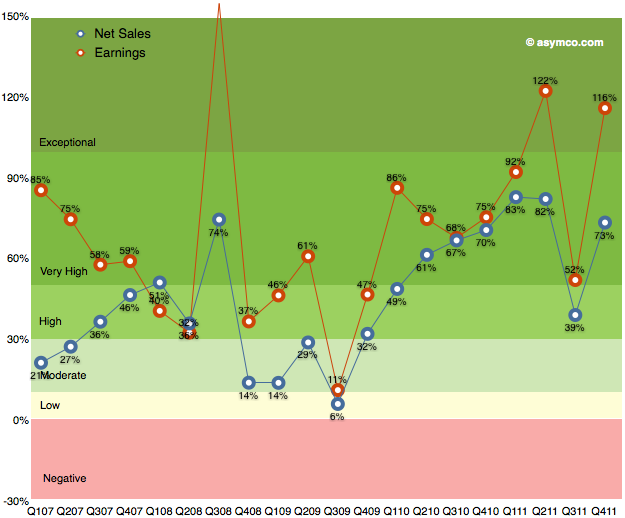
As the chart below shows, the last quarter (fourth calendar 2011, first fiscal 2012) was robust with 116% earnings growth and 73% net sales growth. I’ve heard many superlatives used to describe it. It is certainly exceptional but it was not as good as the second calendar quarter of 2011.
Sales grew faster both in CQ1 and CQ2 of 2011 and earnings grew faster in CQ2. It was in many ways a return to normality due to the iPhone returning to 133% revenue growth after the lull of the transitional third quarter.
Now it’s time to consider the current quarter. It’s already quite late in the quarter to make predictions, but I waited to hear some data about the iPad. The iPad remains a difficult product to forecast. Mainly because it is a new category and the pattern of growth takes a long time to establish. We’ve only had three quarters where y/y growth could be measured. Sales growth has been 180%, 146% and 99%. Unit growth has been 183%, 166% and 110%.
These rates have been higher than the average iPhone growth rates (average of which was 100% in units and 108% in revenues over the calendar 2011). Indeed, the average iPad growth rate so far seems to be 150%.
Is it sustainable?
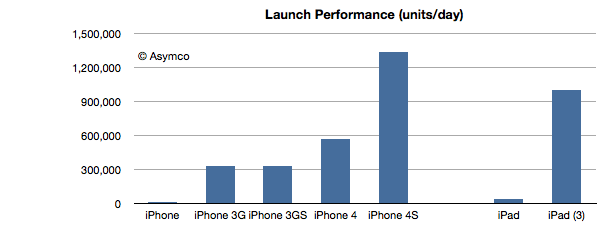
The answer from this latest launch seems to be yes. The following chart shows the launch performance of the various iOS devices whose launch performance has been announced.
The growth in launch performance between iPad 1 and iPad 3 is a factor of 28. iPad third generation had broader distribution but the volume boost from first generation is enormous. This implies a vastly improved production ramp. As the product remains supply constrained, the most important indicator of performance is production throughput.
So given this data on the iPad and the ongoing broadening of the iPhone distribution network, here are my first quarter estimates (with y/y growth in parentheses):
- iPhone units: 37.3 million (100%)
- Macs: 4.7 million (25%)
- iPads: 12.2 million (160%)
- iPods: 7 million (-22%)
- Music (incl. app) rev. growth: 40%
- Peripherals rev. growth: 25%
- Software rev. growth: 10%
- Total revenues: $42.7 billion (growth: 73%)
- GM: 44.7%
- EPS: $12.0 (88%)
This earnings value would imply a trailing twelve months’ EPS of about $40.7. At $600/share the P/E would be 14.7. Cash and equivalents will probably increase to $108 billion.
Discover more from Asymco
Subscribe to get the latest posts sent to your email.


