Charles Arthur, writing for The Guardian, has noted that court filings seem to be revealing Google’s Android revenues. If this is the case, we have a significant breakthrough in understanding the economics of Android and the overall mobile platform strategy of Google.
The new data is a reference to a settlement offer Google made to Oracle of $2.8 million and 0.515% of Android revenues on an ongoing basis. The key assumption to make this data useful is that the $2.8 million offer represents 0.515% of revenues to date.
In other words, that revenues from 2008 to end of 2011 multiplied by 0.00515 results in $2.8 million. That implies that revenues from 2008 to 2011 were $544 million.
I think that’s a fair assumption. I don’t see why Google would offer a higher or lower royalty rate for years 2008 through 2011 than for years after 2011. The offer would seem to be 0.0515% in the future as well as retroactively in the past.
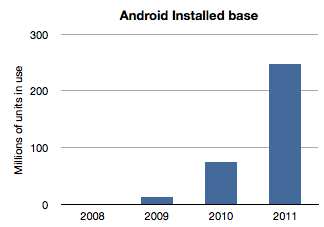
If we work with this assumption then the next question is how to distribute this $544 million over the four years 2008 through 2011? The installed base of Android has grown exponentially and it would seem logical to assume that revenues have followed in a similar pattern. Here is a chart of installed base given activation data supplied by Google.
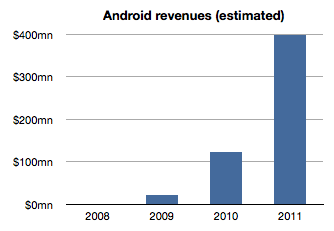
If we assume revenues were distributed the same way we would get something like this:
The sum of the bars in this chart equals $544 million and the ramp is approximately the same as the installed base. The relationship between the first graph and the second is a multiple equivalent to the revenue per device.
Therefore a second assumption is that revenue per device remained fairly constant. In this model the revenue comes out to be about $1.70 per device per year. It’s possible that rev/dev/yr. is increasing as Google services are discovered by users. It’s also possible that the rev/dev/yr. is decreasing as later adopters are less likely to engage as early users. I just don’t know how to adjust this value so by leaving it at the average, I can avoid introducing more assumptions.
Now we can stop and look at this figure and do a test. Does $1.70 make sense as a device revenue for Android? Google had spoken about targeting $10/device/yr. but we have no indication that they are nearly at that level. If they did achieve that level, with an installed base of 300 million, Google could be collecting $3 billion a year in Android income. Are they getting it?
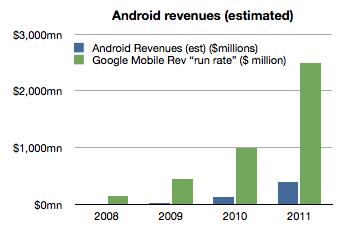
As of October, Google mentioned that it had a $2.5 billion “mobile run rate”. But we know that this figure is not only from Android. Mobile includes all mobile devices and services including those running inside iOS, Symbian, BlackBerry, Windows Phone, etc. They could be counting ads on all mobile browsers as well as ads running inside all apps on all platforms. Furthermore, Google also testified that iOS accounts for two thirds of their mobile search revenues[1].
Adding run rate to the Android revenue chart results in the following:
So the step is to take the “run rate” figure of $2.5 billion and assume, as Charles Arthur did, that iOS income is what is left after taking out the Android part[2]. I also noted that Google previously mentioned a run rate of $1 billion and I will assign that run rate to 2010 and $2.5b to all of 2011. Since we know the number of iOS devices in use for years 2010 and 2011 we can calculate Google’s revenues per iOS device in use.
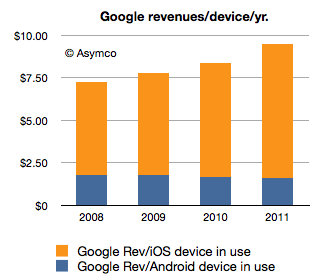
If we thus combine all the data we know (revenues derived from settlement offer, units in use, run rate and iOS installed base) we get the following revenue profile:
This shows a positive trend for Google: revenues per smartphone per year is increasing. However, the growth is coming from non-Android devices which means mostly iOS. Revenues per device for Android is probably declining.
The story for iOS revenues however is not all rosy for Google. Google has to pay for that revenue. The mechanism is a payment that Google makes to Apple for the prominent and default placement of Google search on Safari.
We don’t know the terms of the arrangement but if we assume $2/device Google needs to shave $2 from the top of the chart above with that money going to Apple (attached as iPhone/iPad service revenues.)[3]
That still leaves a healthy $8.33 in 2011 as operating income from mobile with $1.70 or so coming from Android.
However, to make this operating income into bottom line profit, we have to extract the R&D and SG&A associated with mobile at Google. This would be, therefore, Andy Rubin’s yearly budget.
Andy Rubin has stated in the past that Android is profitable. That is certainly believable. The budget would have to be about $400 million/year in 2011.
Charles Arthur concluded that Google obtains four times more revenue from iOS than from Android. My estimates indicate that in 2011 the revenue ratio was closer to 5 but if we subtract the cost of those sales in the form of payments to Apple then the ratio could well be four to one.
Many of these figures begin to “hang together” as we balance assumptions about costs, revenues and statements made in public. There is a consistency within a comfortable margin of error. If that is the case, then the economics of Android begins to take shape.
My take is that it’s not a bad business. But it’s also not a great one. As long as there is exponential growth in units, Android will improve its position inside Google relative to iOS. But from Google’s perspective, iOS is today a bigger business. And iOS is not standing still. It’s growing not only in terms of units but in revenue per unit.
Strategically, and historically Android was never one thing. P&L considerations were not the only (or even at all) factors in investment for Google. Having a hedge against hegemony of potential rivals, having a means to learn and develop new business and having a role in defining the post-PC computing paradigm are all probably bigger considerations than profitability.
So in terms of returns, Android is sustainable. However, in relative terms the value created leaves much to be desired. Whereas Android generates $1.70/device/year and thus an Android device with a two year life generates about $3.5 to Google over its life, Apple obtained $576.3 for each iOS device it sold in 2011[4]. The economics of Android are nothing like the economics of iOS.
—
Notes:
- This figure is also not conclusive as search is not the only form of revenue on a mobile device but it does imply that Android is not the majority of Google’s mobile revenues.
- Clearly this is overstating iOS as the non-Android income is broken up between several platforms. We can only say that iOS is the vast majority of non-Android income.
- Assuming a $2/device payment model means Google paid $312 million to Apple in 2011 and $171 million in 2010. This would go toward boosting Apple’s revenue per iOS device. Naturally, if this distribution cost is higher or would be subject to re-negotiation then it could vary widely.
- The iOS figure includes accessories and licensing of trademarks but excludes income from App Store, iTunes music, movies, TV shows, iBooks, greeting cards or textbooks.
Discover more from Asymco
Subscribe to get the latest posts sent to your email.


