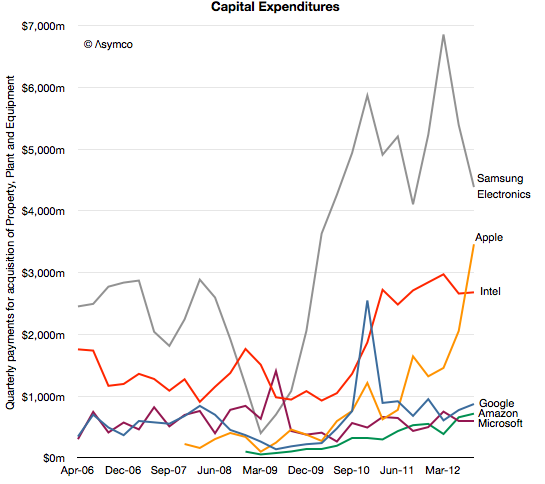
In the post reviewing Samsung’s Capital Structure I noted that its component divisions have historically taken 90% of capital investments and that the overall capital intensity for Samsung Electronics has increased in proportion to its component revenues.
In another post regarding the capital structures of other technology companies with different business models I noted that Apple has changed its capital structure to a significant degree over the previous three years.
In the following graph I combined these observations to show how capital expenditure patterns may be used to discern the underlying business model.
I would group “cloud” or “platform” based companies like Google, Amazon and Microsoft as a cohort which, although spending significant amounts on capital equipment, do so mainly to support services. Their primary employment of capital is to sustain the infrastructure of data centers necessary to deliver the services underpinning their business models.

