
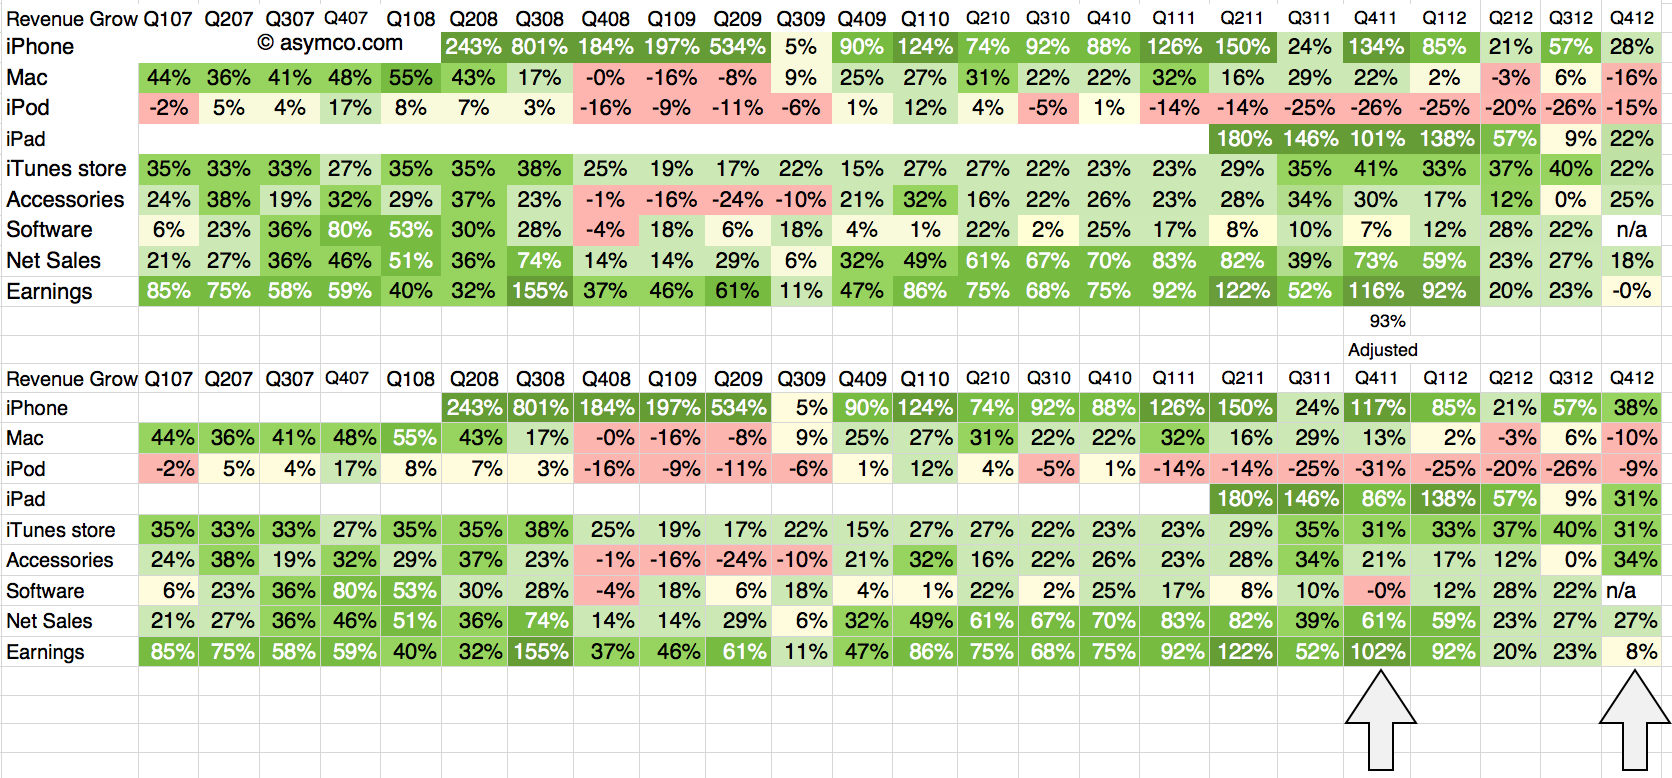
The fourth quarter of 2012 was 13 weeks in duration while the fourth quarter of 2011 was 14 weeks. The difference implies that a comparison of revenues should be done with an adjusted 93% of the 2011 values. The growth for 4Q 2011 relative to 4Q 2010 should also be adjusted on this basis.
The following tables show the unadjusted and adjusted growth rates. The adjustments apply to the bottom table and the columns highlighted.
As in previous scorecards, I used the following color scheme to “grade” the performance.
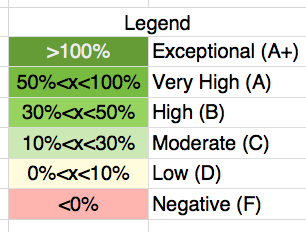
The adjustment brings growth in sales to a respectable 27%, well above the 18% unadjusted level. In fact, using the color map grading system four lines increase their rating from “Moderate” to “High” growth: iPhone, iPad, iTunes, Accessories all move from the 20’s to 30’s percent growth.
The bottom line moves from 0% to 8% growth but it’s still low relative to historic performance. That had to do with margins; more about that later.
The graphs showing Revenue and Earnings growth with and without adjustments are shown below:
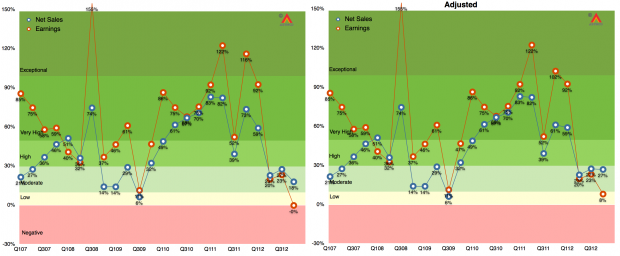
Note that iPad, iPhone, Accessories and iTunes/Software are based on re-stated figures.
Note also that the adjusted 2011 growth rates do not change dramatically with only iPad changing from Exceptional to Very High.
Discover more from Asymco
Subscribe to get the latest posts sent to your email.