
In the last few posts I estimated the iTunes economy in some detail. In absolute figures, the revenues and cost structures of iTunes are substantial:
- 6.3 billion transactions in the last quarter
- $4.6 billion consolidated revenues (including software & services)
- $3.3 billion in content payments
- $650 million in operating income
However, as a part of the entire Apple revenue model, iTunes appears to be a small contributor. The following diagrams shows where revenues came from and where they were spent during the last quarter
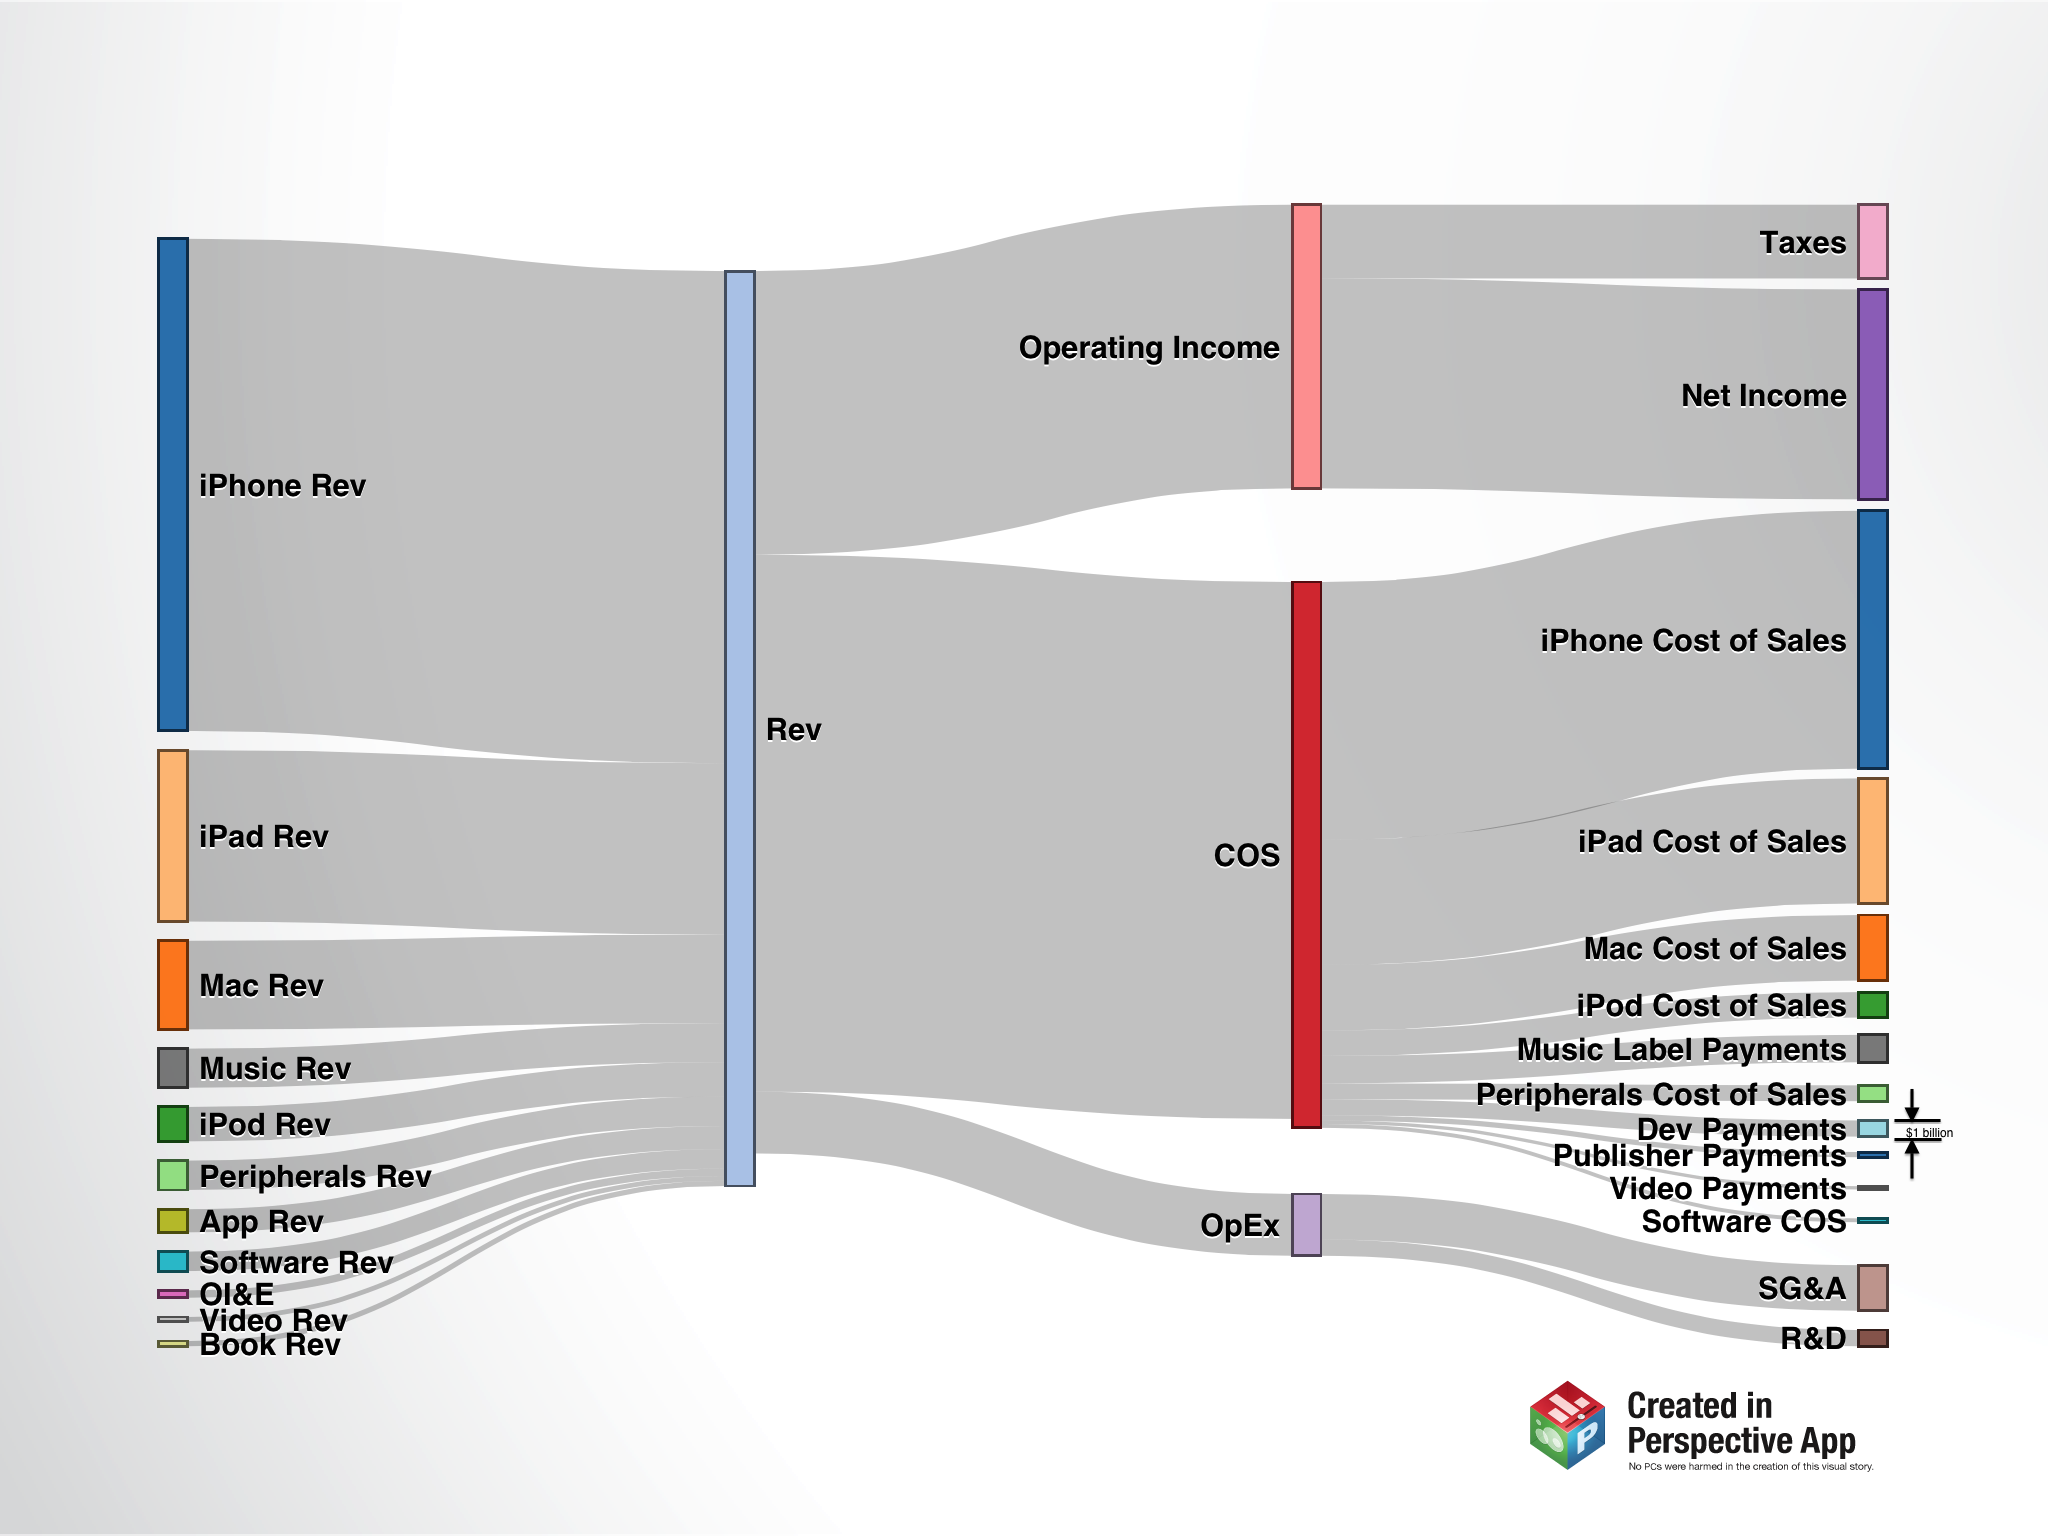
A few notes:
- Click on image to enlarge. The graph was produced using an iPad and it is rendered at iPad retina resolution.
- The data covers only the Fourth Calendar Quarter of 2012.
- For scale reference, “Dev Payments” equals $1 billion (as marked.)
- When zoomed in, each pixel represents about $50 million (vertical dimension).
- Revenues shown are “gross” and therefore greater than reported. See post on iTunes Revenue Recognition. �The same reason affects the total Cost of Sales (COS).
- Sources of revenue are ranked according to size. Note that Music is higher than iPod or Peripherals and Apps are higher than Software.
- Different Cost of Sales components are also ranked by value.
- iTunes which is the sum of Music, App, Software, Video and books makes up about 7% of overall revenues but 10% of costs of sales and hence contribute about 4% (est.) of total operating margin.
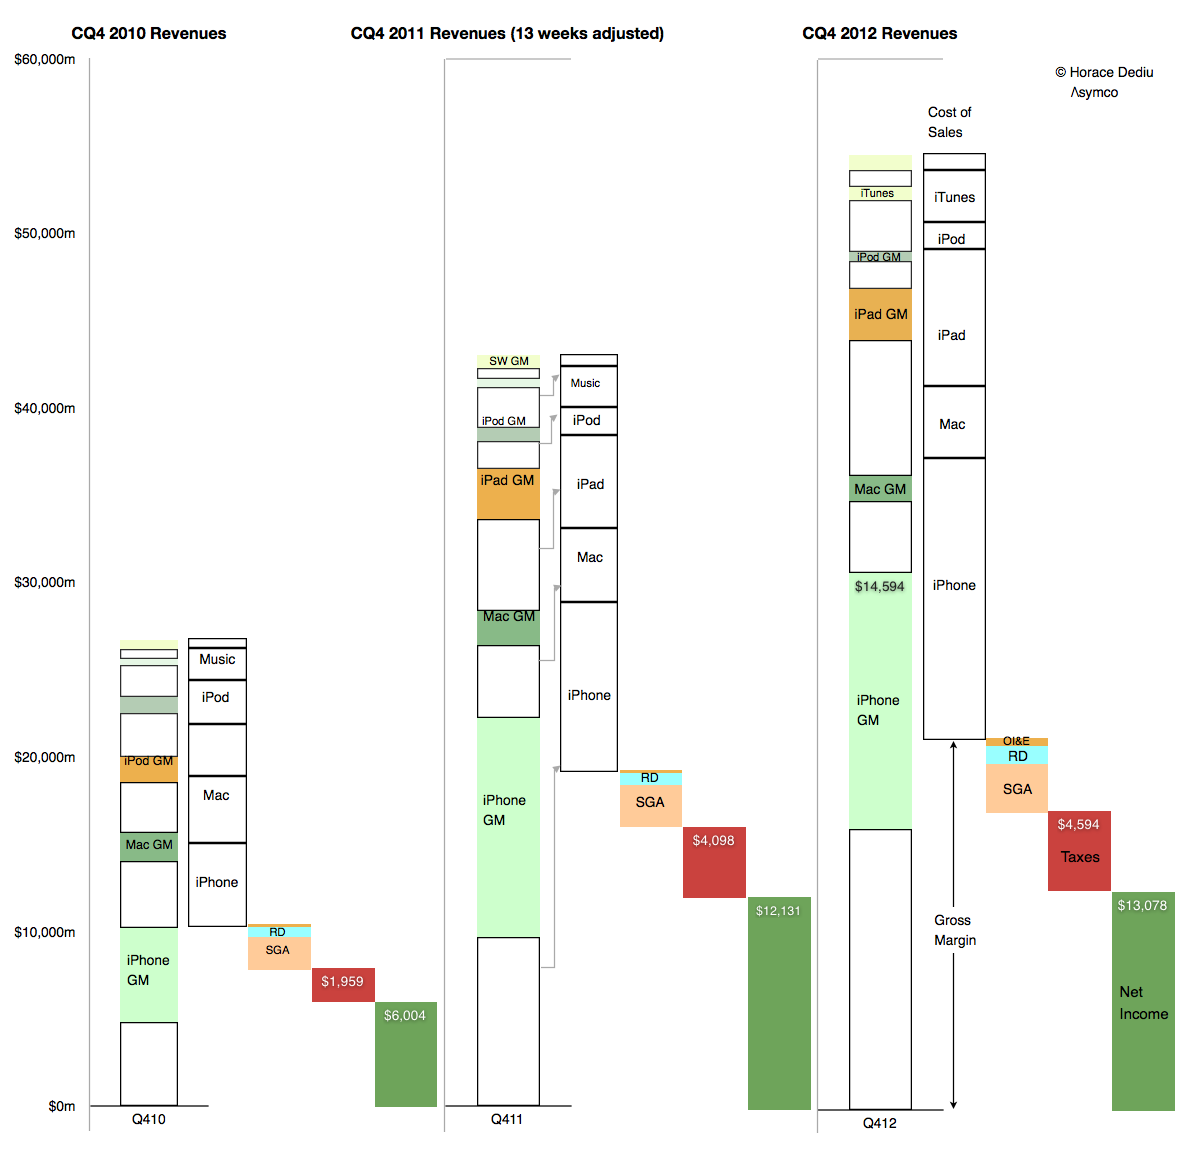
A three year view of the same data is shown below:
Discover more from Asymco
Subscribe to get the latest posts sent to your email.