
As part of a continuing series on the iTunes economy I described how iTunes fits within Apple’s overall revenue and cost structure. The operation is a modest contributor accounting for single-digits percent of revenue and operating margins.
One additional question is how does iTunes compare with other non-Apple retail businesses. The obvious comparable businesses are Google Play and Amazon’s digital content businesses. Unfortunately we can’t compare iTunes with Google Play because Google does not reveal any details about Play revenues (or units sold/downloaded or payments to developers or any other data.)
Also unfortunately, we can’t compare iTunes with Amazon digital sales because Amazon does not provide that detail either.
What we do have is Amazon’s overall revenues (and operating margin.) So that’s what I have compared:
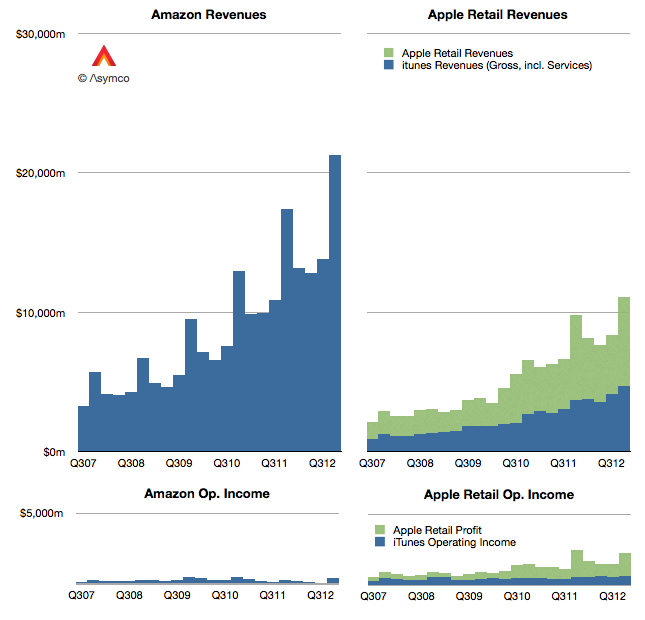
Since we have Amazon’s overall retail revenues it seemed fitting to also add Apple’s physical store retail data on top of iTunes for additional perspective.
Here are some observations:
- Since 2008, Amazon’s sales grew by a factor of 2.18. Apple’s combined iTunes+Retail grew by 2.14x.
- Apple’s gross retail revenue was $11.1 billion in Q4, 52% of Amazon’s overall revenues.
- Apple’s operating income from retail in 2012 was $6.8 billion, over ten times Amazon’s $676 million.
Although Apple’s overall retail operations are only about half of Amazon’s they are far more profitable on an operating level. They are also growing at a similar pace. Amazon as an equity is priced at approximately twice sales. By that ratio, Apple’s retail business would be worth $70 billion. Of course, that valuation presumes that, as with Amazon, operating profits are disposable.
Discover more from Asymco
Subscribe to get the latest posts sent to your email.