Apple's biggest acquisition

At the end of the first quarter 2013 there were 946,035,000 fully diluted shares of Apple stock outstanding. At the end of the second quarter there were 924,265,000. The 21,770,000 shares that disappeared were purchased by Apple and retired. Apple shares traded between $390 and $463 during the quarter so it’s hard to know exactly how much Apple paid for them, but at an average of $426.5 per share Apple would have spent $9.3 billion

Management explains:

In late April we executed a very successful debt offering issuing 17 billion of debt across 3, 5, 10 and 30 year maturities. We paid $2.8 billion in dividends in the quarter and we also utilized a total of $16 billion in cash on share repurchase activity through a combination of a new accelerated share repurchase program and open market purchases. $12 billion of the $16 billion was utilized under a new ASR program initiated with two financial institutions in April.

An initial delivery of 23.5 million shares was made under this program with the final number of shares delivered in average price per share to be determined at the conclusion of the program, based on the volume weighted average purchase price of Apple’s stock over the program period, which will conclude in fiscal ‘14. In addition to the new ASR, we executed $4 billion of open market share repurchases, resulting in the retirement of 9 million additional shares.

Later, during Q&A: Continue reading “Apple's biggest acquisition”

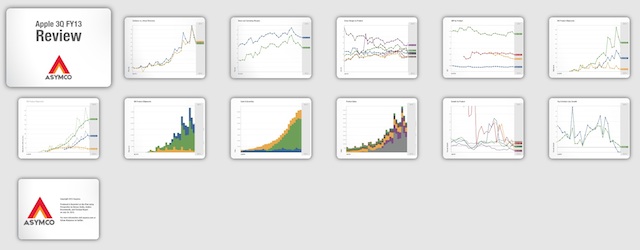
Apple’s 3Q FY13 Review (Padcast)

Preview 3Q-13 screenshot

Using interactive graphics and narration, this latest Apple Earnings Review discusses Apple’s performance in relation of its historic performance as well as to expectations (published in the Preview) on the following topics:

  1. Guidance vs Actual performance: Now that Apple changed the way it provides guidance, are we seeing a new degree of precision in their signaling. We look at the history of earnings guidance and how effective (or not) the current method is in helping predict performance.
  2. Gross and Operating Margins analysis: What is the pattern of margins and how important are margins to the perception of competitiveness?
  3. Margins by product. How are margins allocated by product?
  4. Average selling prices for each product. Any surprises in Pricing? What was the magnitude, cause and significance of iPhone ASP drop.
  5. iOS product shipments. Comparison with expectations, trends and explanations. Overall iOS growth story.
  6. Cash balance and the effect on cash of share re-purchase.
  7. Sales growth and Earnings growth, a long term retrospective.

Duration is about 1hr.

As a reminder, the Padcast can be reviewed interactively users can access to the underlying data.

It’s available for download on the iPad for $19.99. Those who already bought the Preview will be receiving an updated version soon that includes the Review at no extra charge.