
Apple revenues grew at the rate of about 6% in Q4, while earnings grew at 5%. These were improvements over Q3 and Q2 but the rate of top line growth is has not been this low since 2009. The bottom line is also slower than it’s been for the entire “epoch” or era of the iPhone.
The components of sales growth are shown in the following table:
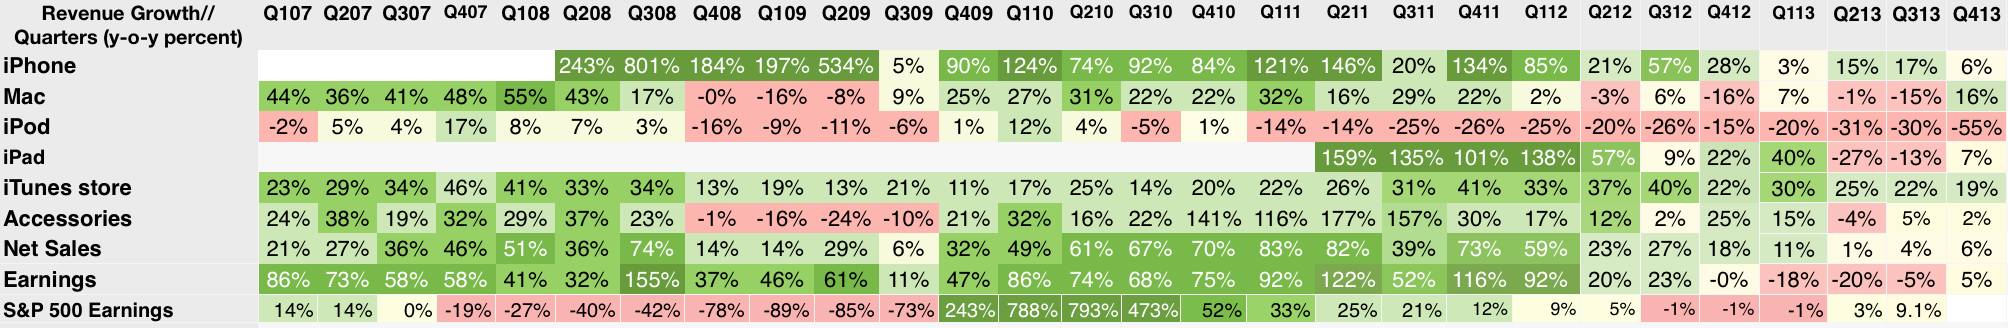
The company delivered performance inline with its own guidance so there should not have been surprises in the top and bottom lines. However, the disappointment might be in the low growth for iPhone (at 6%) and iPad (at 7%). The Mac and iTunes grew at moderate rates (16% and 19% respectively) while the iPod continued its decline with -55% growth and Accessories remained fairly flat.
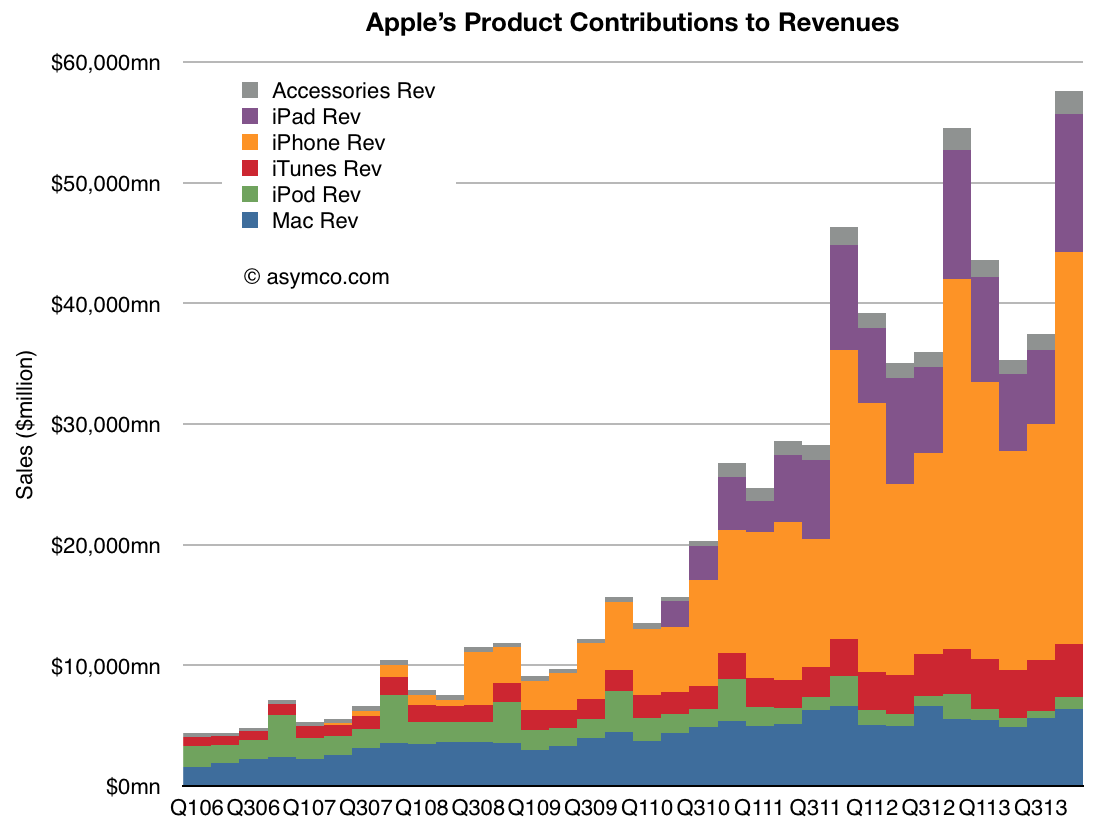
As the graph below shows, the iPhone and iPad are the bulk of the business so their performance is a large part of what is observed.
The speed with which products are introduced and scaled is phenomenal so it is more important than ever to see beyond the trajectory of existing products into the pattern of the introduction of new product categories.
Markets are effective in anticipating the path of a technology as it ascends into the hands of users, especially if it is destined for ubiquity. But markets are completely incapable of anticipating the emergence of new technologies.
In this regard markets are a reflection of common sense rather than uncommon wisdom.
Discover more from Asymco
Subscribe to get the latest posts sent to your email.