
In Part 1 of a look at Google’s future I showed that Google’s revenues have been highly correlated with the population of Internet users in the markets it serves. If there were a causal relationship between population of users and revenue growth then the company would face a growth inflection point when that population becomes half penetrated.
In Significant Digits Episode 1 (Part 1) I showed data which suggests that the inflection point will come in 2016. Essentially the argument is that Google’s growth is ultimately limited by the population of users and that itself is a predictable number. I also used the example of the PC and smartphone penetration curves to show how the perception of the fortunes of companies whose revenues are based on those technologies were affected by inflections in their respective adoptions.
However, correlation is not causation. These users we count are not the customers who pay for Google’s services. Users (or usage) is therefore only a proxy. It may be a good proxy and intuitively it makes sense that it’s a driver of growth but fundamentally the company lives on a stream of revenues paid by advertisers1. In order to really evaluate the opportunity we need to “follow the money” and track down where it comes from.
We don’t have visibility into the exact sources of these revenues but we have a top-level geographic segmentation (shown below.)
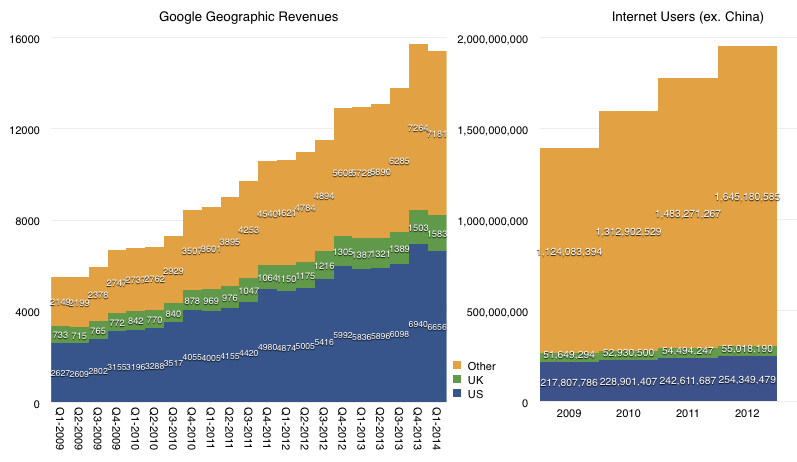
The data shows that in the most recent quarter 53% of Google’s revenues came from the US and UK. Five years ago the proportion was 61%. Clearly then about 10% of the mix shifted to non US/UK.
If we exclude China, US and UK, in 2009 there were 1.07 billion Internet consumers. By 2012 there were 1.59 billion users in those same territories. The growth is therefore almost 50%, and this excludes 2013. The corresponding growth in the US/UK was 15%. We should also note that in the same time frame, there were almost a billion Android activations but the number of new users in the US2 was only about 70 million (or 7%).
It’s therefore clear that whereas the population of Internet users and the ways they might access Google exploded in the last five years, Google revenues have come disproportionately from US/UK consumers. Or, at least from US/UK advertisers, which we are assuming are primarily targeting local users.
The result is the following revenue per user per year based on where the users reside:
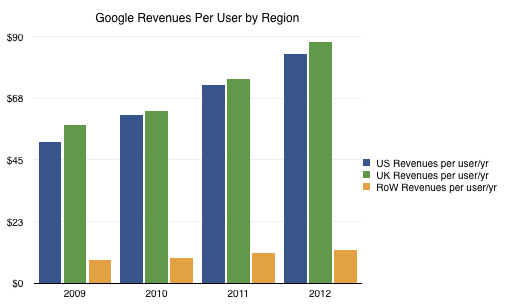
The disproportionate weight of US/UK income and the low growth of income from rest-of-world vs. the far faster growth of usage outside the US/UK means that the toughest nut for Google to crack is not penetration but emerging market monetization.
The disparity is enormous. US/UK revenue is on average $86/user/yr (2012) and rising. The rest of the world only manages $12/user/yr. That Rest Of World includes many wealthy countries such as all of Europe and Japan. So the problem for Google is that it has an order of magnitude less income per user in the part of the internet which remains unpenetrated and the trends show that they are not narrowing the gap.3
Google’s R&D efforts seem to be oriented around creating consumption (Making it Rain) but the problem is that the quality of that consumption and the indigenous sources of income are unaddressed. These problems are structural and based on social constructs which don’t change at the pace of technology adoption.
- This is true to date and certainly it could change but hints of how that might change are still not visible to me [↩]
- as measured in comScore [↩]
- The ratio between average US/UK and RoW revenue per user/yr was 6 in 2009, 7 in 2010, 7 in 2011 and 7 in 2012 [↩]
Discover more from Asymco
Subscribe to get the latest posts sent to your email.