
After n quarters of predictability, Apple surprised with sales performance that was 3.74% above the top of their guidance. This may not seem significant but since instituting a new range-bound guidance method in Q1 of last year the company reported revenue within about 1% of the top of the range.
This is in stark contrast to the wide variance in prior years. The following graph shows the “error” in guidance as the percent difference between reported sales and guidance1.
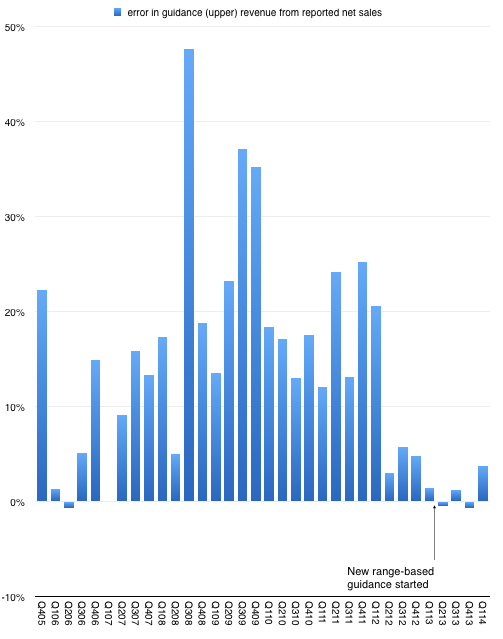
So prior to last quarter we were lulled into thinking that guidance was very nearly perfectly predicting the company. As I tweeted, it took the “sport” out of trying to do any forecasting. All an analyst had to do is tweak the main product growth figures to hit the sales target and then subtract the (generously provided) operating expenses and (also provided) tax rate to get the earnings. Only unknown to getting to an estimate of EPS was how many shares would still be outstanding.2
Knowing Apple also means that average selling prices are also very rigidly set in stone so the degrees of freedom in analysis were becoming highly constrained.
But just when you think you spotted a pattern, it changes. The company surprised with performance outside the band. The following graph shows the estimate ranges it has given and the actual revenues delivered.3
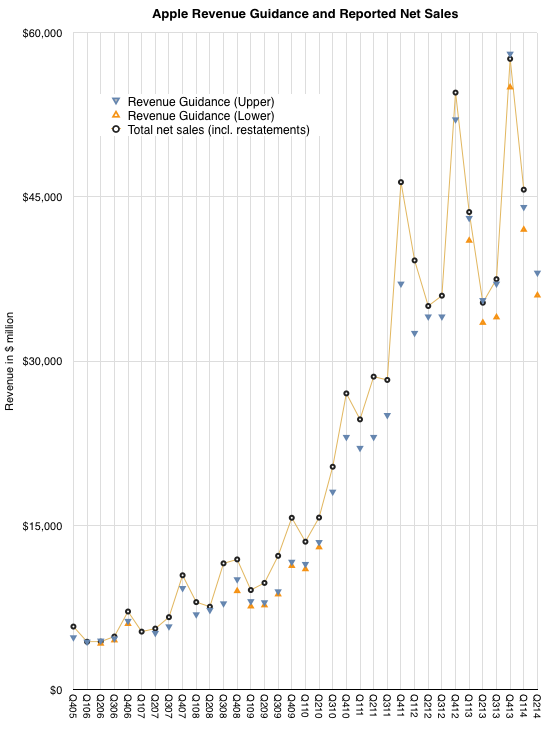
So what happened?
The answer seems to be better iPhone performance. The following table shows my expectations, which were tuned to return revenues exactly at the top of the guidance range.
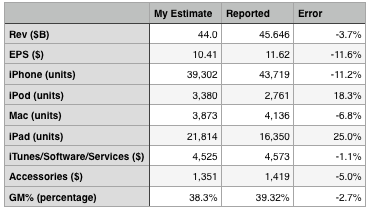
On product shipments/sales I underestimated the iPhone and Mac and overestimated the iPad and iPod. I estimated iTunes accurately and underestimated accessories by 5%. I also generally got the blend of margins fairly close, being 1 point too low on gross margin.
The bottom line was that the Revenue and Earnings surprise could be accounted for through a significant outperformance on iPhone which offset a less significant underperformance on the iPad.
The iPhone grew sales by 14% which more than offset a drop of 13% in iPad sales and was enough to allow net sales to grow by 5%. Since the company guided nearly flat growth, that 5% was a big surprise.
Now one could ask whether 14% growth in the iPhone revenues is a meaningful change in the long-term evolution of the category. This is a difficult question. The way the iPhone is positioned makes it a great success in the premium segment of the market but it does not place it in competition with the perhaps 80% of the market which seems to be defined by a lower price point.
However let’s not forget that pricing is correlative to the market but it may not be causal. Purchase decisions are complex and price is one aspect of that decision. But there are many others. Availability, channels, service, brand all play parts. The error of many analysts is to conclude that price and price alone is causal to behavior. That may be so with commodities, but let us not forget that these products and their uses are newly created and how value is perceived has been changing rapidly. Buyers follow a learning curve in terms of discovering the uses and value of products. These learning curves can be modeled and usually show several years (sometimes decades) for most populations between early and late adoption.
We don’t know where the iPhone is on the learning curve for any particular region and that means we can still be surprised by how it grows.