
In The Capitalist’s Dilemma, Clayton Christensen and Derek van Bever introduce a powerful new theory which explains the relative paucity of growth in developed economies. They draw a causal relationship between the mis-application of capital in pursuit of innovation and the failure to grow.1
In particular, they observe that capital is allocated toward the type of innovations which increase efficiency or performance and not toward those which create markets (and hence long term growth and jobs.) This itself is caused by a prioritization and rewarding of performance ratios rather than cash flows and that itself is due to a perversion of the purpose of the firm.2
For this statement of causality to be confirmed we need to observe whether it predicts measurable phenomena. For instance, we need to see whether companies which create markets apply capital toward market-creating innovations and whether companies which create value through efficiencies or performance improvements hoard abundant capital.
Over the entire global economy, the pattern of capital over-abundance is easy to see. The amount of cash or securities on balance sheets is extraordinary and unprecedented (estimated at $7 Trillion, doubling over a decade). However, growing cash is not a perfect indicator of inactivity. Cash is the by-product of earnings after investment. So if operating profits are growing and investment is growing, but not as fast, then it’s possible to grow cash while still growing investment.
The better measure is investment in capital equipment or, more specifically, purchases of plant, property and equipment.3 Indeed, on a global scale, capital expenditure as a percent of sales is at a 22-year low.
CapEx is a good proxy for non-financial “investment”. It’s also a measure that can be easily obtained as companies report this activity in their Cash Flow Statements.
So the best method for assessing the theory’s predictive power is to look at market creators and measure their investment in PP&E. At the same time we need to look at market sustainers and measure their (probable) lack of investment in PP&E.
So here is my first attempt:
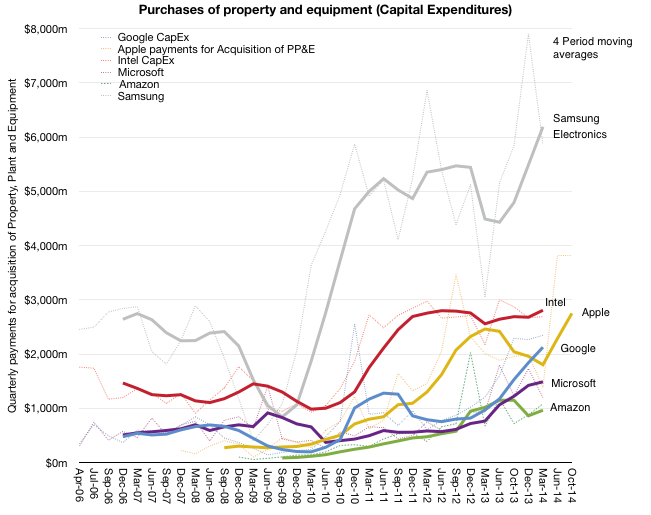
It’s an admittedly small sample of companies that are not that dissimilar. But within this group, over the time frame of about 9 years, we can see how capital expenditures are growing.4 This sample shows that for a few companies, the amount spent on capital equipment grew dramatically. Especially since they are in businesses that might be thought of as not capital intensive.
Consider Amazon: an Internet company if there ever was one. Their purchasing of capital equipment (in which they also classify software) went from 373 million in 2009 to $3.8 billion in last four quarters! The average spending was $84 million in the four quarters ending September 2009 and $964 million in the year ending March 2014. Amazon is investing in data centers and distribution centers and they are growing that asset base with an eye toward future growth.
In contrast, consider Intel. Intel is in the most capital-intensive corner of the technology industry: semiconductors. They still manufacture their own so their investment in “fabs” continues. But Intel failed to create a market for mobile devices. The number of ARM processors shipped in 2013 was about 10 billion units while the number of Intel processors shipped was around 400 million.
So despite being an innovator, Intel did not create a market. They still increased their CapEx but only by a factor of 2. Is this because Intel did not invest in market-creating innovations? Had they invested in market-creation, would they be increasing CapEx accordingly?
Now look at Samsung. Samsung has grown CapEx by a similar factor to Intel (from pre-recession $2.5B/quarter to average of $5.5 during the last three years). Did Samsung create markets? Much of the expenditure went toward supplying components to itself and Apple (and others). In that regard, they did not create the market but filled it and optimized it.
Then there’s Google. Google increased CapEx from an average of $476 million/quarter in 2006 to $2.125 billion in the last four quarters. That’s an increase of 347%. Google spends almost all CapEx on data centers and we can see a pattern where CapEx growth anticipates service growth. However, the growth is not as pronounced as Amazon’s.
Microsoft also grew CapEx. Their investment mirrors that of Google: data centers. Microsoft increased from an average of $508 million/quarter (very similar to Google) in 2006 to $1.5 billion today. That increase is about 200%, slower than Google but in the same trend. Did Microsoft create a market since 2006? In terms of cloud computing and software as a services, yes. Their spending growth reflects infrastructure that supports a new business model.
Finally there’s Apple. In this time frame Apple did create the iPhone and iPad and their growth went from less than $200 million/quarter in CapEx to over $2.5 billion/quarter. The increase is nearly 10x over 25 quarters.
To summarize, the following graph shows the increase in average quarterly spending (over a four quarter period) between 2006 and the present for these companies.
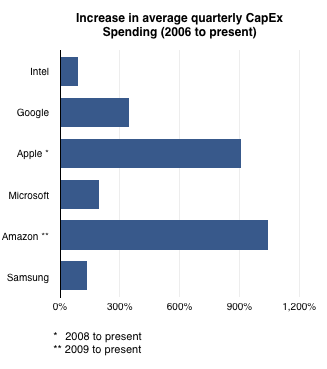
The degree of “market creation” may be visible to the naked eye: Apple and Amazon did clearly create markets and they show highest CapEx growth while Intel and Samsung did not and they show the slowest CapEx growth. Google is continuing the expansion of a new market as is Microsoft and their CapEx growth is roughly proportional to these efforts.
At least from this small sample the theory seems to hold. CapEx and market creation are at least correlated. Much more analysis needs to be done, especially to discover the anomalies, but from the perspective of some of the most valuable and rapidly growing large companies, their commitment to capital expenditures is evident.
- and, indirectly, in the increase in inequality and hence the destabilization of socio-political institutions [↩]
- That being the creation of customers not shareholder returns [↩]
- Operating expenditures can also be measured but they cannot grow inorganically due to most of the costs being related to skilled employment which has supply constraints. [↩]
- Note that Apple’s data extends to the end of their fiscal year and reflects their forecast given last October in the 10-K filing [↩]
Discover more from Asymco
Subscribe to get the latest posts sent to your email.