
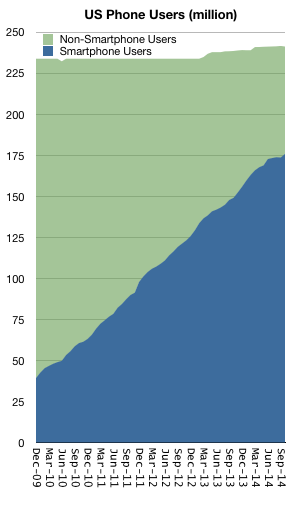
At the end of October 2014 about 73% of US mobile users owned a smartphone. In March of 2005 2% of US mobile users owned a smartphone (comScore). In absolute terms the number of users increased from about 4 million to 176 million and these 172 million new users were added in less than one decade.
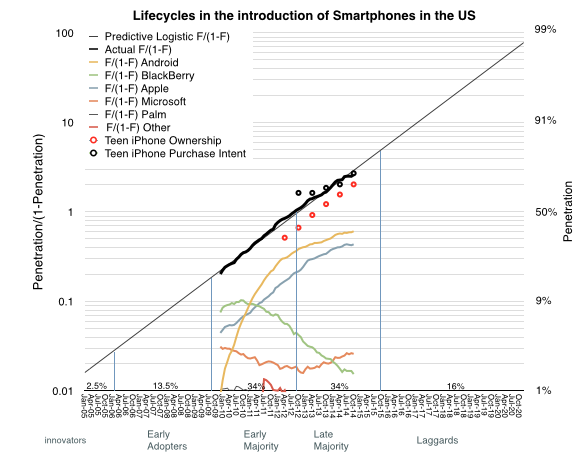
Remarkable as that may be, what is even more exciting is that the pattern of adoption is predictable. The following graph charts the adoption of this product category with a monthly resolution between January 2010 and October 2014.
Knowing the datum for March 2005 allows us to fill-in the graph with a logistic function approximation for the period to date.
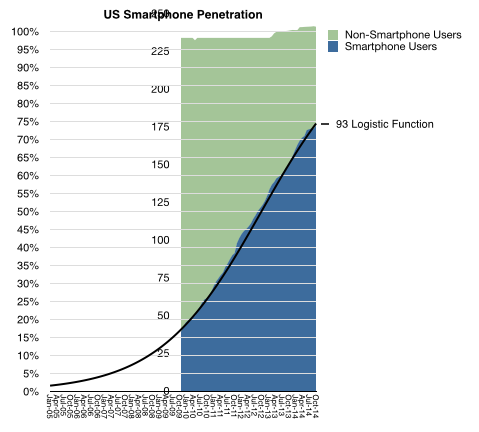
The logistic function is a wonderful model for how technologies are adopted. It’s been evident in samples take for dozens of diffusions, from 18th century canal construction, 19th century railroads, 20th century consumer products as well as industrial and agricultural innovations and the internet itself.
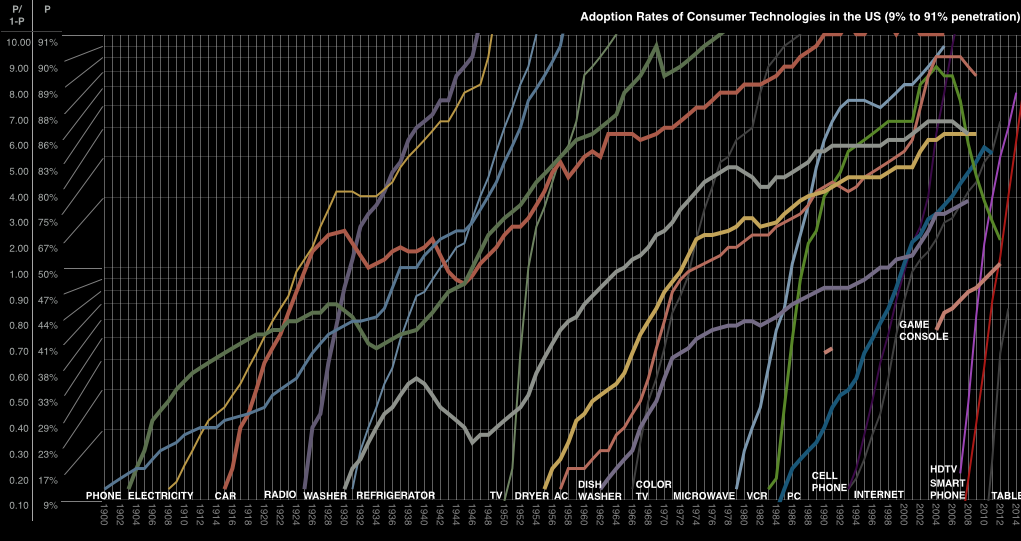
The reason the logistic curve is so commonly observed is because of its reflection of sociological behavior. When a technology serves a manifest need (or can be hired for a distinct, unmet job to be done) its universal adoption is a certainty. The only unknown is the rate at which this happens. As the graphs above show, some technologies are rapid (examples) and some are slow. Some could be constrained by the communication of its benefits or by the presence of regulation or by the unavailability of infrastructure or resources or financing. Conversely, some could be accelerated by conformability with existing infrastructure or by network effects resulting from communication between adopters. The balance between accelerants to adopting and the constraints on adoption yields the “slope” in the logistic curve.
So given a high degree of confidence in the model, we can forecast how smartphones will be adopted. This model yields further details such as when the various classes of adopter (Early/late/laggard) will join and perhaps that itself will allow managers to plan their marketing and product development.
It would seem therefore that this tool is the answer to building a successful and sustainable enterprise. It would seem that the early movers would have an advantage as their users create the virtuous cycle of learning which the firm will use to capture later adopters. It would seem that firms can effect strategy changes to adopt to each wave of users added to the user base.
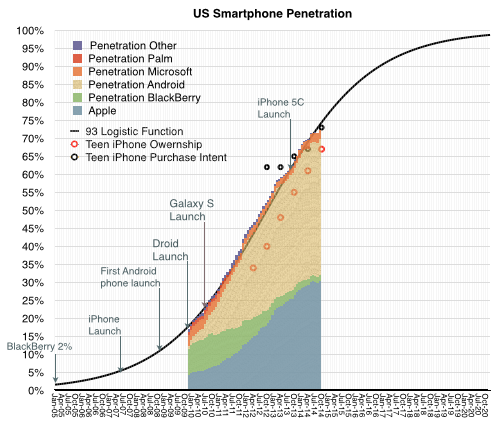
It would seem but it has not proven to be the case. For most technology categories, the predictability of adoption has not aided or informed success for firms competing to supply the burgeoning market. If we look at the firms which supply the smartphone market in the US (with platforms as proxies) we see how much turnover has occurred. All the early movers are highly disadvantaged and even some of the later entrants are not assured of viability into the later stages of the market.
It’s a something of a paradox that as a technology takes root we might be able to predict how it gets bought but not who will sell it.
This paradox is at the root of the volatility in asset pricing around technology firms. The question investors typically sweat is not whether a company is in the right market, but whether it’s in the right time.
Discover more from Asymco
Subscribe to get the latest posts sent to your email.