
In The Number I provided a model for estimating the number of active Apple devices at any point in time. The relationship between active devices and cumulative devices sold gives us a rule of thumb that says that 2 out of 3 devices ever sold are active.
I propose now that knowing active devices and cumulative devices sold allows one to determine the average device lifespan.
The following graph is a visual representation of how to obtain it:
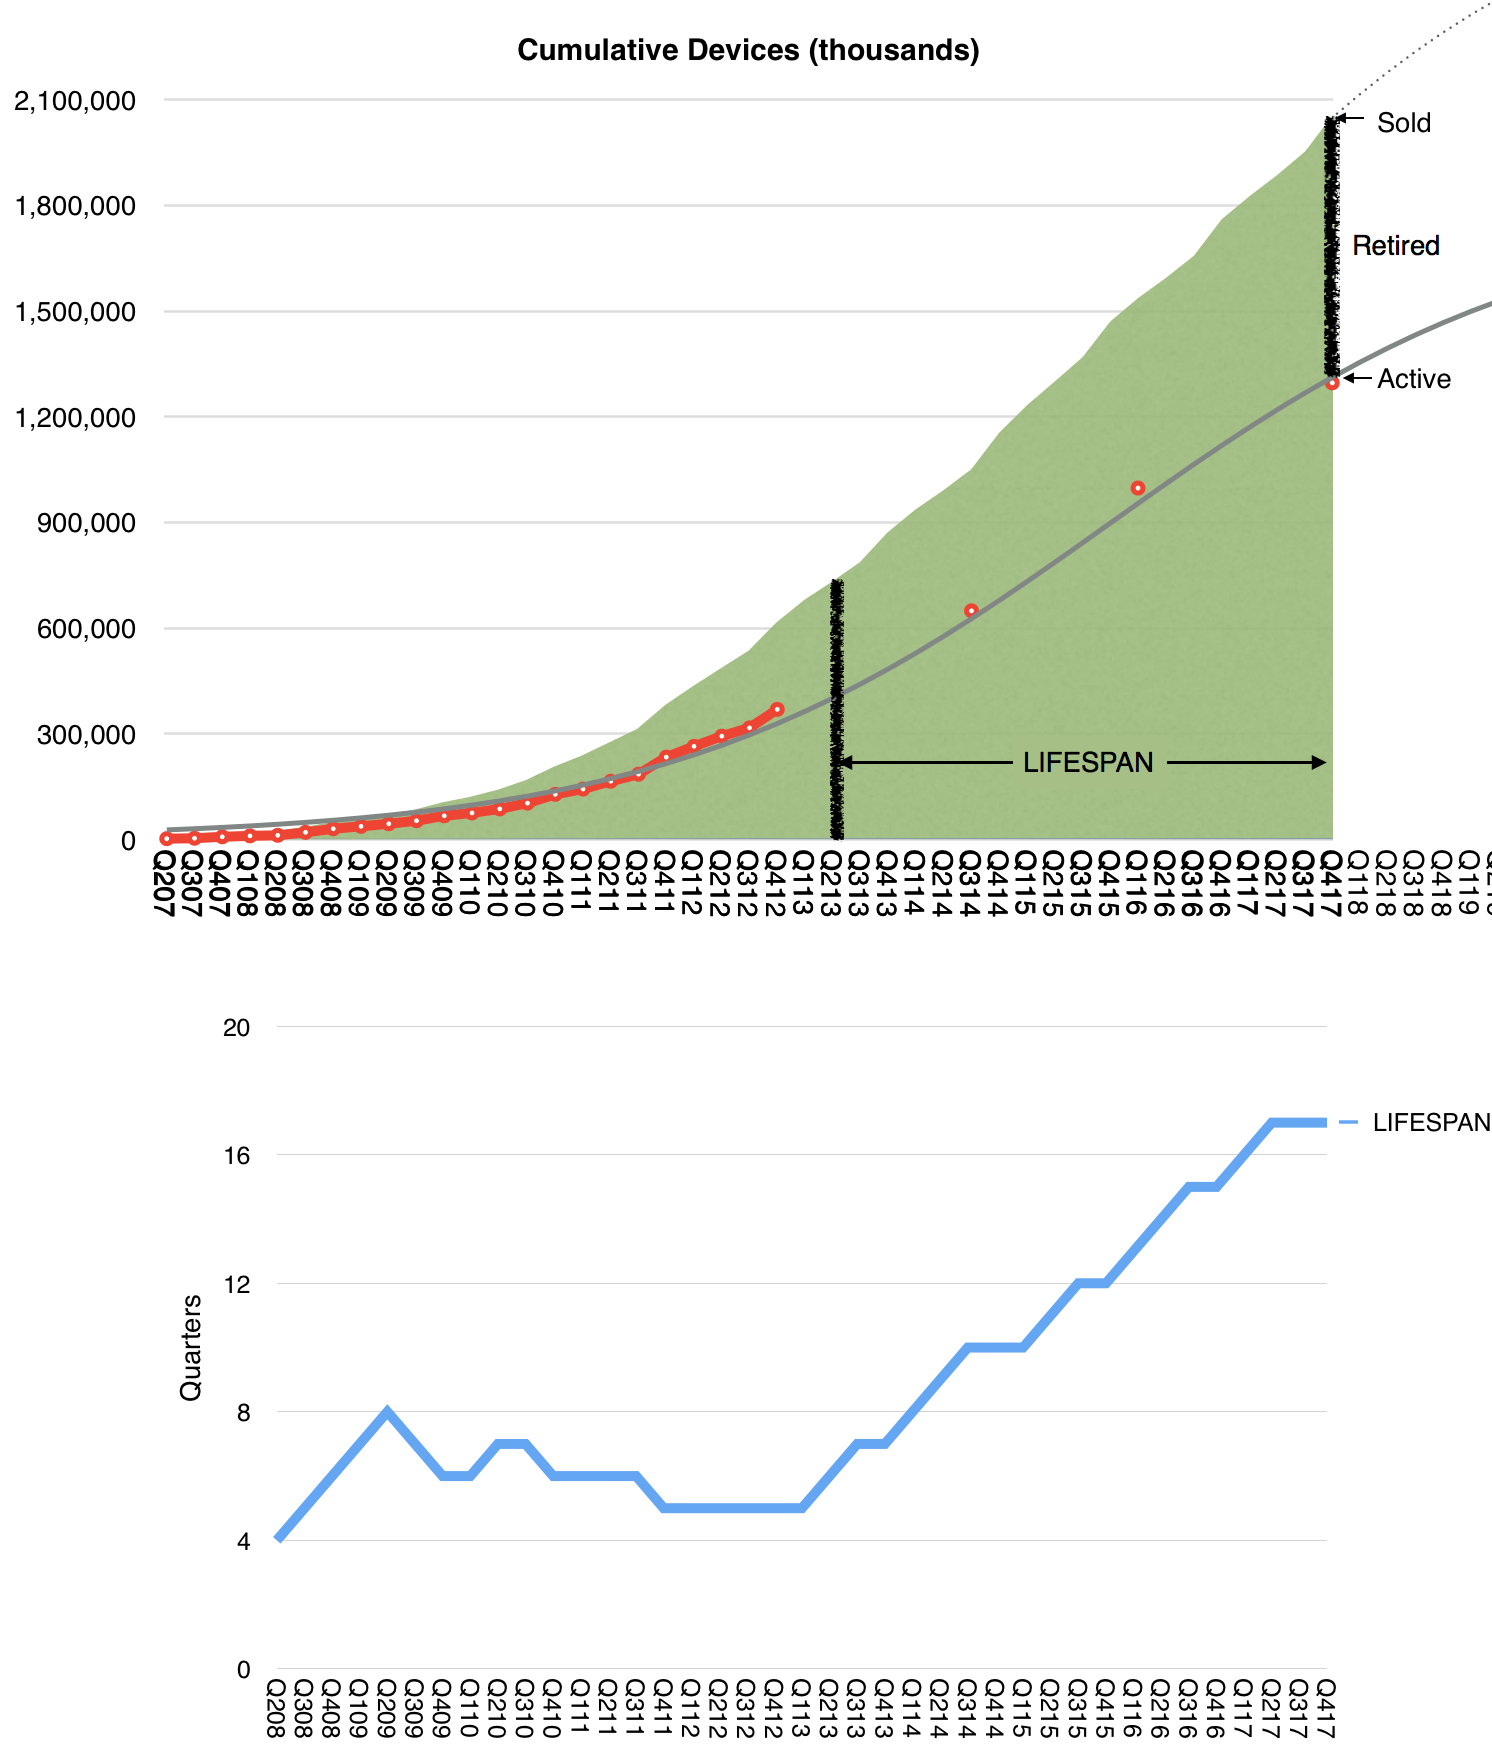
Note that the second graph shows how the lifespan evolved over time.
Here’s how to compute this yourself: Visually, the lifespan is the distance horizontally between the two vertical bars such that the bars are the same length. The top vertical bar measures the gap between the area (cumulative devices) and the curve (active devices) and the lower bar is the gap between the area and the x-axis, i.e. the cumulative devices. When those two bars are the same size the distance between them is the lifespan (at the time of the top bar.)
Arithmetically, the average lifespan at a given time t is the duration between t and the moment when the cumulative devices sold reached the cumulative retired devices at time t.1
For example today–as the visual above represents–the lifespan is the time since cumulative devices sold reached the current total retired devices. The cumulative retired devices can be calculated as 2.05 billion cumulative sold minus 1.3 billion active or 750 million. The time when cumulative devices sold reached 750 million was the third quarter 2013. The lifespan is thus estimated at the time between now and Q3 2013 or 17 quarters or about 4 years and three months.
Note that cumulative devices sold includes Macs, iPhones, iPads, Apple Watches and iPod touch. Since (apart from the Watch2 ) this information is public, the only figure needed to determine lifespan at any time is active devices and that total is available through the logistic fit described in The Number.
In The Number I argued that active devices is a breakthrough in quantifying the value of Apple’s business. The first insight is into the size of device (read: user) base, the second is in the resilience of that device base (2/3 in use). Now we see the third insight: the specific length of time or duration of use per device–a proxy for user satisfaction and loyalty. This I (and Deming) argue, is the most important measure of the health of a business because it speaks of the future and not, as all other figures do, the past.
I’ll show in the next post how this single number allows us to calculate the net present value of Apple’s future cash flows, or, by definition, Apple’s enterprise value.
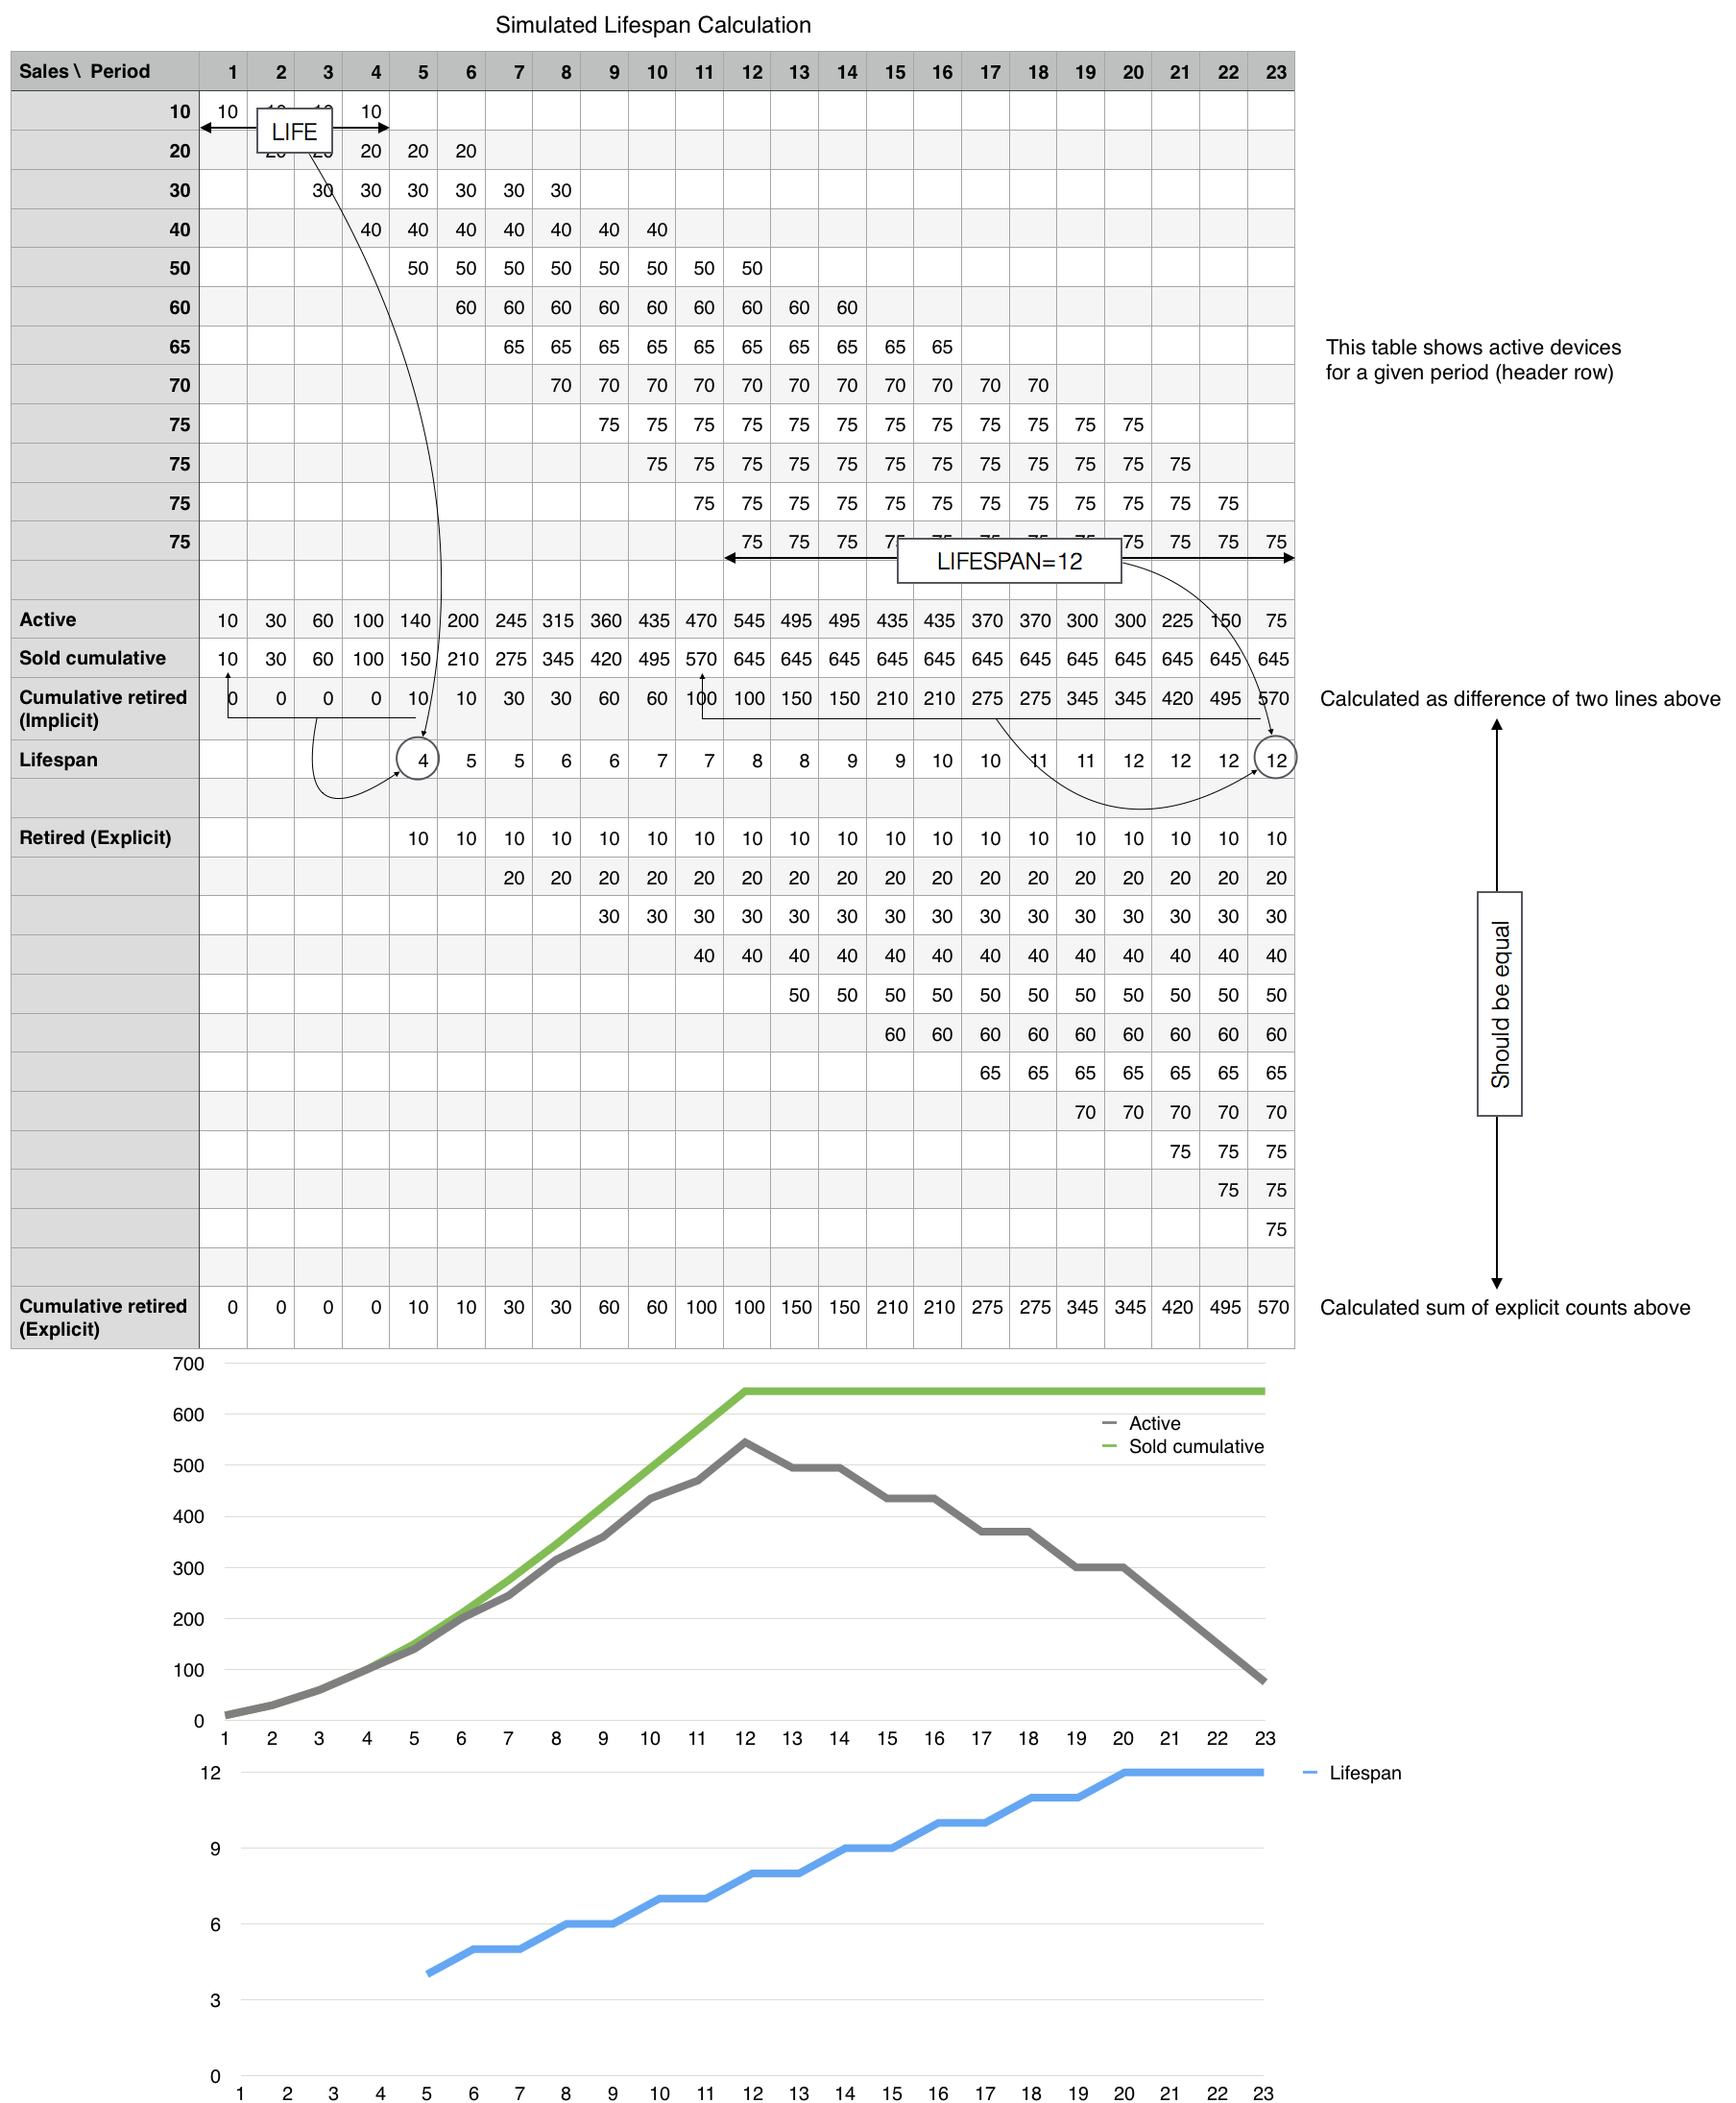
- For a simulation and tabular explanation see below
 [↩]
[↩] - Which I calculate to a satisfactory precision here [↩]
Discover more from Asymco
Subscribe to get the latest posts sent to your email.