
At the latest Apple Summit in Los Angeles the question of Apple’s valuation was foremost on many minds. The illustration I used there to discuss valuation is shown below.
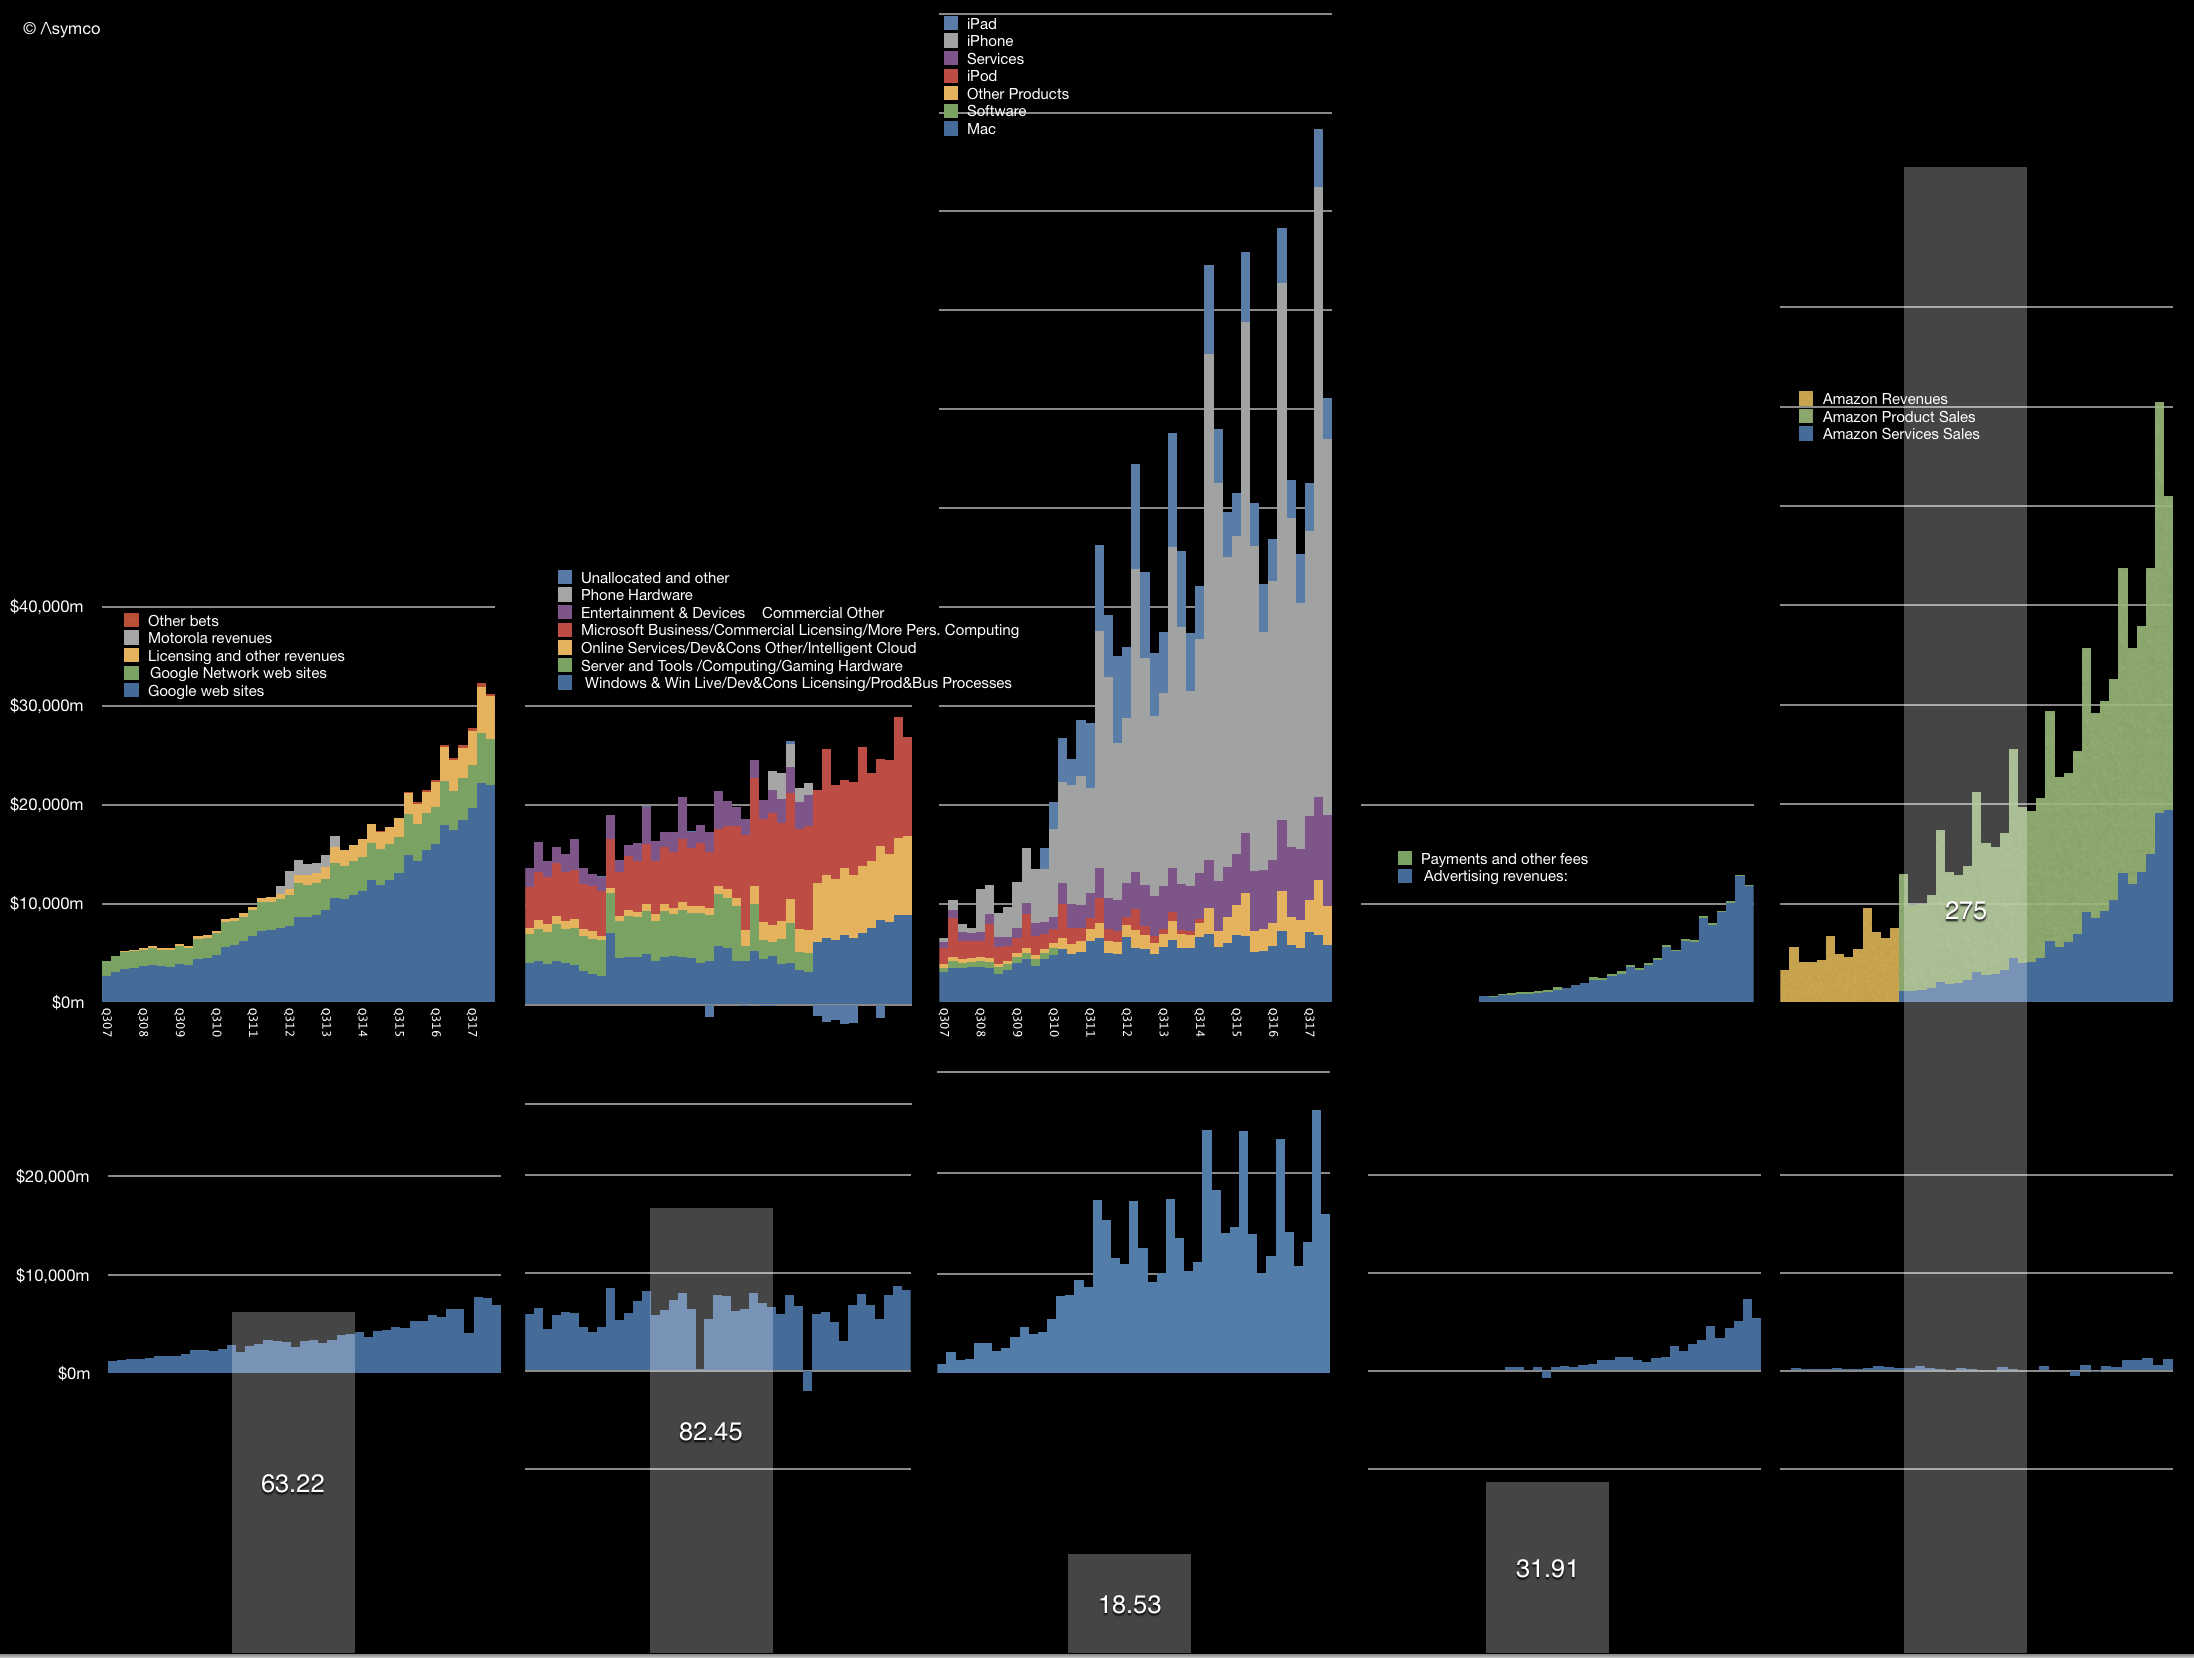
It shows the history of revenues (by reported segments) and gross margin for the five largest companies in the world by market capitalization. I have been publishing this illustration for five years1 in order to contrast the growth and perception of value between companies that might be considered comparable with Apple. Thus the graphs show the top and (near) bottom lines of the companies over an epoch of about a decade.2
In contrast with the histories above, there is a price set on the equities today. These prices are captured by the market capitalizations as follows:
| Current market cap (billion) | Peak market capitalization (Billion) | |
| Apple |
$918 |
$955 |
| Amazon |
$844 |
$856 |
| Alphabet |
$810 |
$825 |
| Microsoft |
$780 |
$789 |
|
$584 |
$589 |
Market capitalizations are interesting because they show perceptions of value. The traders in the equity are negotiating with each other on what the shares are worth and, as a voting system in a liquid public asset, share pricing is very representative of the perceptions about that asset. Representative because there are literally millions of decisions being made on a daily basis which determine this price.
Continue reading “On knowing the value of everything and the price of nothing”