Charles Arthur, writing for The Guardian, has noted that court filings seem to be revealing Google’s Android revenues. If this is the case, we have a significant breakthrough in understanding the economics of Android and the overall mobile platform strategy of Google.
The new data is a reference to a settlement offer Google made to Oracle of $2.8 million and 0.515% of Android revenues on an ongoing basis. The key assumption to make this data useful is that the $2.8 million offer represents 0.515% of revenues to date.
In other words, that revenues from 2008 to end of 2011 multiplied by 0.00515 results in $2.8 million. That implies that revenues from 2008 to 2011 were $544 million.
I think that’s a fair assumption. I don’t see why Google would offer a higher or lower royalty rate for years 2008 through 2011 than for years after 2011. The offer would seem to be 0.0515% in the future as well as retroactively in the past.
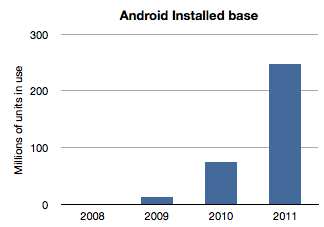
If we work with this assumption then the next question is how to distribute this $544 million over the four years 2008 through 2011? The installed base of Android has grown exponentially and it would seem logical to assume that revenues have followed in a similar pattern. Here is a chart of installed base given activation data supplied by Google.

If we assume revenues were distributed the same way we would get something like this: Continue reading “Android Economics”


