For more analysis of Apple & the industry, join us at ACTIVE 2025.

The billion dollar hobby

During the latest shareholder meeting Tim Cook revealed that Apple TV sales were above $1 billion in the last fiscal year (ending September 2013). The company later clarified that this figure includes device and content sales.

This poses a problem. In previous statements the company cited device (unit) shipments rather than value. The statements made to date suggested that cumulative volume of 3rd (current) generation Apple TV totaled 6 million units as of January 1, 2013.

The following graph includes an estimate of quarterly Apple TV sales based on comments made to date.

Screen Shot 2014-03-02 at 3-2-8.07.43 PM

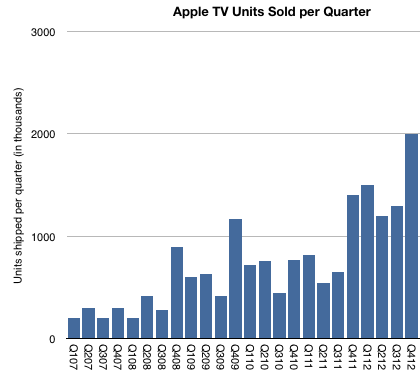
As there were no additional comments during 2013, the “Billion Dollar” quote is all we have to go with for the year.  The problem with trying to separate content from hardware is complicated by several factors: Continue reading “The billion dollar hobby”

Horace Dediu drops in to chat on MWC 2014

It’s a good thing Horace Dediu got ready to start our Mobile World Congress #MWC14 tweetchat #IBMMWCChat on 2/24 a few minutes early – because as usual, the dialogue took off fast and went full steam ahead for an hour. Here is our basic topic list (ordering is mine, chat was slightly different)

  • Android Commoditization
  • Nokia,
  • Microsoft and Google
  • The OS, The Platform and the Ecosystem
  • Tizen
  • Wearables
  • Monetize This
  • The Operator Challenge
  • Nest again
  • The odds and endings

Read Tweet transcript here: Horace Dediu @Asymco drops in to chat on #MWC14 | Electronics industry.

Nokia welcomes Android developers

Barcelona, Spain – Today at Mobile World Congress, Nokia unveiled five new affordable handsets including a new family of smartphones debuting on the Nokia X software platform. Based on the Android Open Source Project AOSP, and backed by Nokias deep ties with operators, the Nokia X platform gives AndroidTM developers the chance to tap into, and profit from, a rapidly expanding part of the market.

via Nokia welcomes Android developers; expands global developer footprint with momentum across Lumia and Asha » Nokia – Press.

It’s worth remembering the distinction between operating systems, platforms and ecosystems.

Today’s announcement is consistent with the declaration of Nokia is engaged in a “war of ecosystems.” Note that this is in contrast to “a war of platforms” or a “battle of operating systems” or a “competition of devices.”

Devices are commoditizing, operating systems are commodities and the Android platform is a commodity. Value will not be captured in any of these technology modules. Ecosystems are another matter. It’s where Facebook (and its acquisitions) reside. It’s where Google lives and it’s where iTunes has been for a decade.

Nokia’s adoption of AOSP as an operating system is consistent with the ecosystem strategy set forth three years ago, and is also consistent with Microsoft’s competitive strategy.

Which is why I believe Microsoft is not only comfortable with this development but had agreed to it over a year ago when work on this initiative was already well under way.

Apple’s Growth Scorecard

Apple revenues grew at the rate of about 6% in Q4, while earnings grew at 5%. These were improvements over Q3 and Q2 but the rate of top line growth is has not been this low since 2009. The bottom line is also slower than it’s been for the entire “epoch” or era of the iPhone.

The components of sales growth are shown in the following table:

Screen Shot 2014-02-05 at 12.05.10 PM

The company delivered performance inline with its own guidance so there should not have been surprises in the top and bottom lines. However, the disappointment might be in the low growth for iPhone (at 6%) and iPad (at 7%). The Mac and iTunes grew at moderate rates (16% and 19% respectively) while the iPod continued its decline with -55% growth and Accessories remained fairly flat.

As the graph below shows, the iPhone and iPad are the bulk of the business so their performance is a large part of what is observed. Continue reading “Apple’s Growth Scorecard”

The Critical Path #109: Google Ventures

Horace builds on his discussion of Google from the previous episode in light of the Nest acquisition news. We also look at the relatively unreported news regarding China lifting its 13-year ban on game consoles and the variables it introduces to a “big niche” industry.

via 5by5 | The Critical Path #109: Google Ventures.

Google’s three Ps

A company is nothing more (and nothing less) than three things: people, processes and purposes. In the language of the software engineer these would be inputs, algorithms and specifications. In the language of classical business analysis they are assets (or resources), organization structures and business models. In military theory, these are logistics, tactics and strategy.

This is the trinity which allows for an understanding of a complex system: the physical, the operational and the guiding principle. The what, the how and the why.

When approaching any analysis problem, these questions form the foundation of causal inference. What is it, how does it work and why does it exist?

When analyzing nature the sciences often help with the what and the how but rarely address the why.1 In contrast, man-made systems (e.g. systems of law, religion and commerce) require an answer to the why as there is a presumption of a will in their creation and preservation. The why allows ultimate judgement on the merit of an enterprise. The why may escape us but it’s assumed to always be there. For instance, in criminal law the motive is often a crucial piece of evidence but it’s not always found. In business, the motive for action or for organization is a crucial piece of the puzzle which often explains the what, who and how, but here the ultimate why is usually profit. This the characteristic of a for-profit business, the purpose is explicit.

Continue reading “Google’s three Ps”

  1. Religion attempts to answer the whys which science leaves as unanswerable. []

Apple Fourth Quarter Estimates

As Philip Elmer-DeWitt is still interested in my estimates I provided the following:

Revenues ($B) 57.8
EPS ($) 14 (908m shares)
iPhone (units) 56.4 million
iPod (units) 7.6 million
Mac (units) 4.14 million
iPad (units) 26.5 million
iTunes/Software/Services ($) 4.2B
Accessories ($) 2.2B
GM% (percentage) 37.1%

I arrived at these estimates without looking at anyone else’s (except for Apple’s own published guidance). Soon after sending them I noticed that Daniel Tello published his own.

In the same format as above, I quote them for comparison. Please visit his post for additional detail.

Revenues ($B) 59.0
EPS ($) 14.92 (895m shares)
iPhone (units) 56 million
iPod (units) 9 million
Mac (units) 4.65 million
iPad (units) 25.5 million
iTunes/Software/Services ($) 4.3B
Accessories ($) 1.8B
GM% (percentage) 37.8%

The graph below shows the history of revenue guidance vs. revenue reported. The last quarter shows my estimate for net sales.

Screen Shot 2014-01-15 at 1-15-4.06.58 PM

Note that the company achieved at or slightly above its upper guidance ever since they started offering a range for guidance (i.e. since Q1 2013). My estimate for sales is therefore very near the top of guidance. The figures for units earnings and margins all result from this assumption.

When Apple reached parity with Windows

In 2013 there were 18.8 times more Windows PCs sold than Macs. This is a reduction in the Windows advantage from about 19.8x in 2012. This decline is mostly due to the more rapid decline in Windows PC shipments relative to the more modest decline in Mac unit shipments. Gartner estimates that about 309 million Windows PCs were shipped,1 down from 337 million in 2012 (which was down from 344 million in 2011, the year PCs peaked.) I estimate about 16.4 million Macs were shipped in 2013 down from 17 million in 2012.

The history of PC shipments relative to Mac shipments is shown in the following graph:

Screen Shot 2014-01-13 at 1-13-3.09.21 PM

I chose to graph the Mac data as an area with additional areas for iOS devices layered on top.

Continue reading “When Apple reached parity with Windows”

  1. This figure is not published publicly but can be derived from subtracting Mac shipments from the total PC shipments which are published []