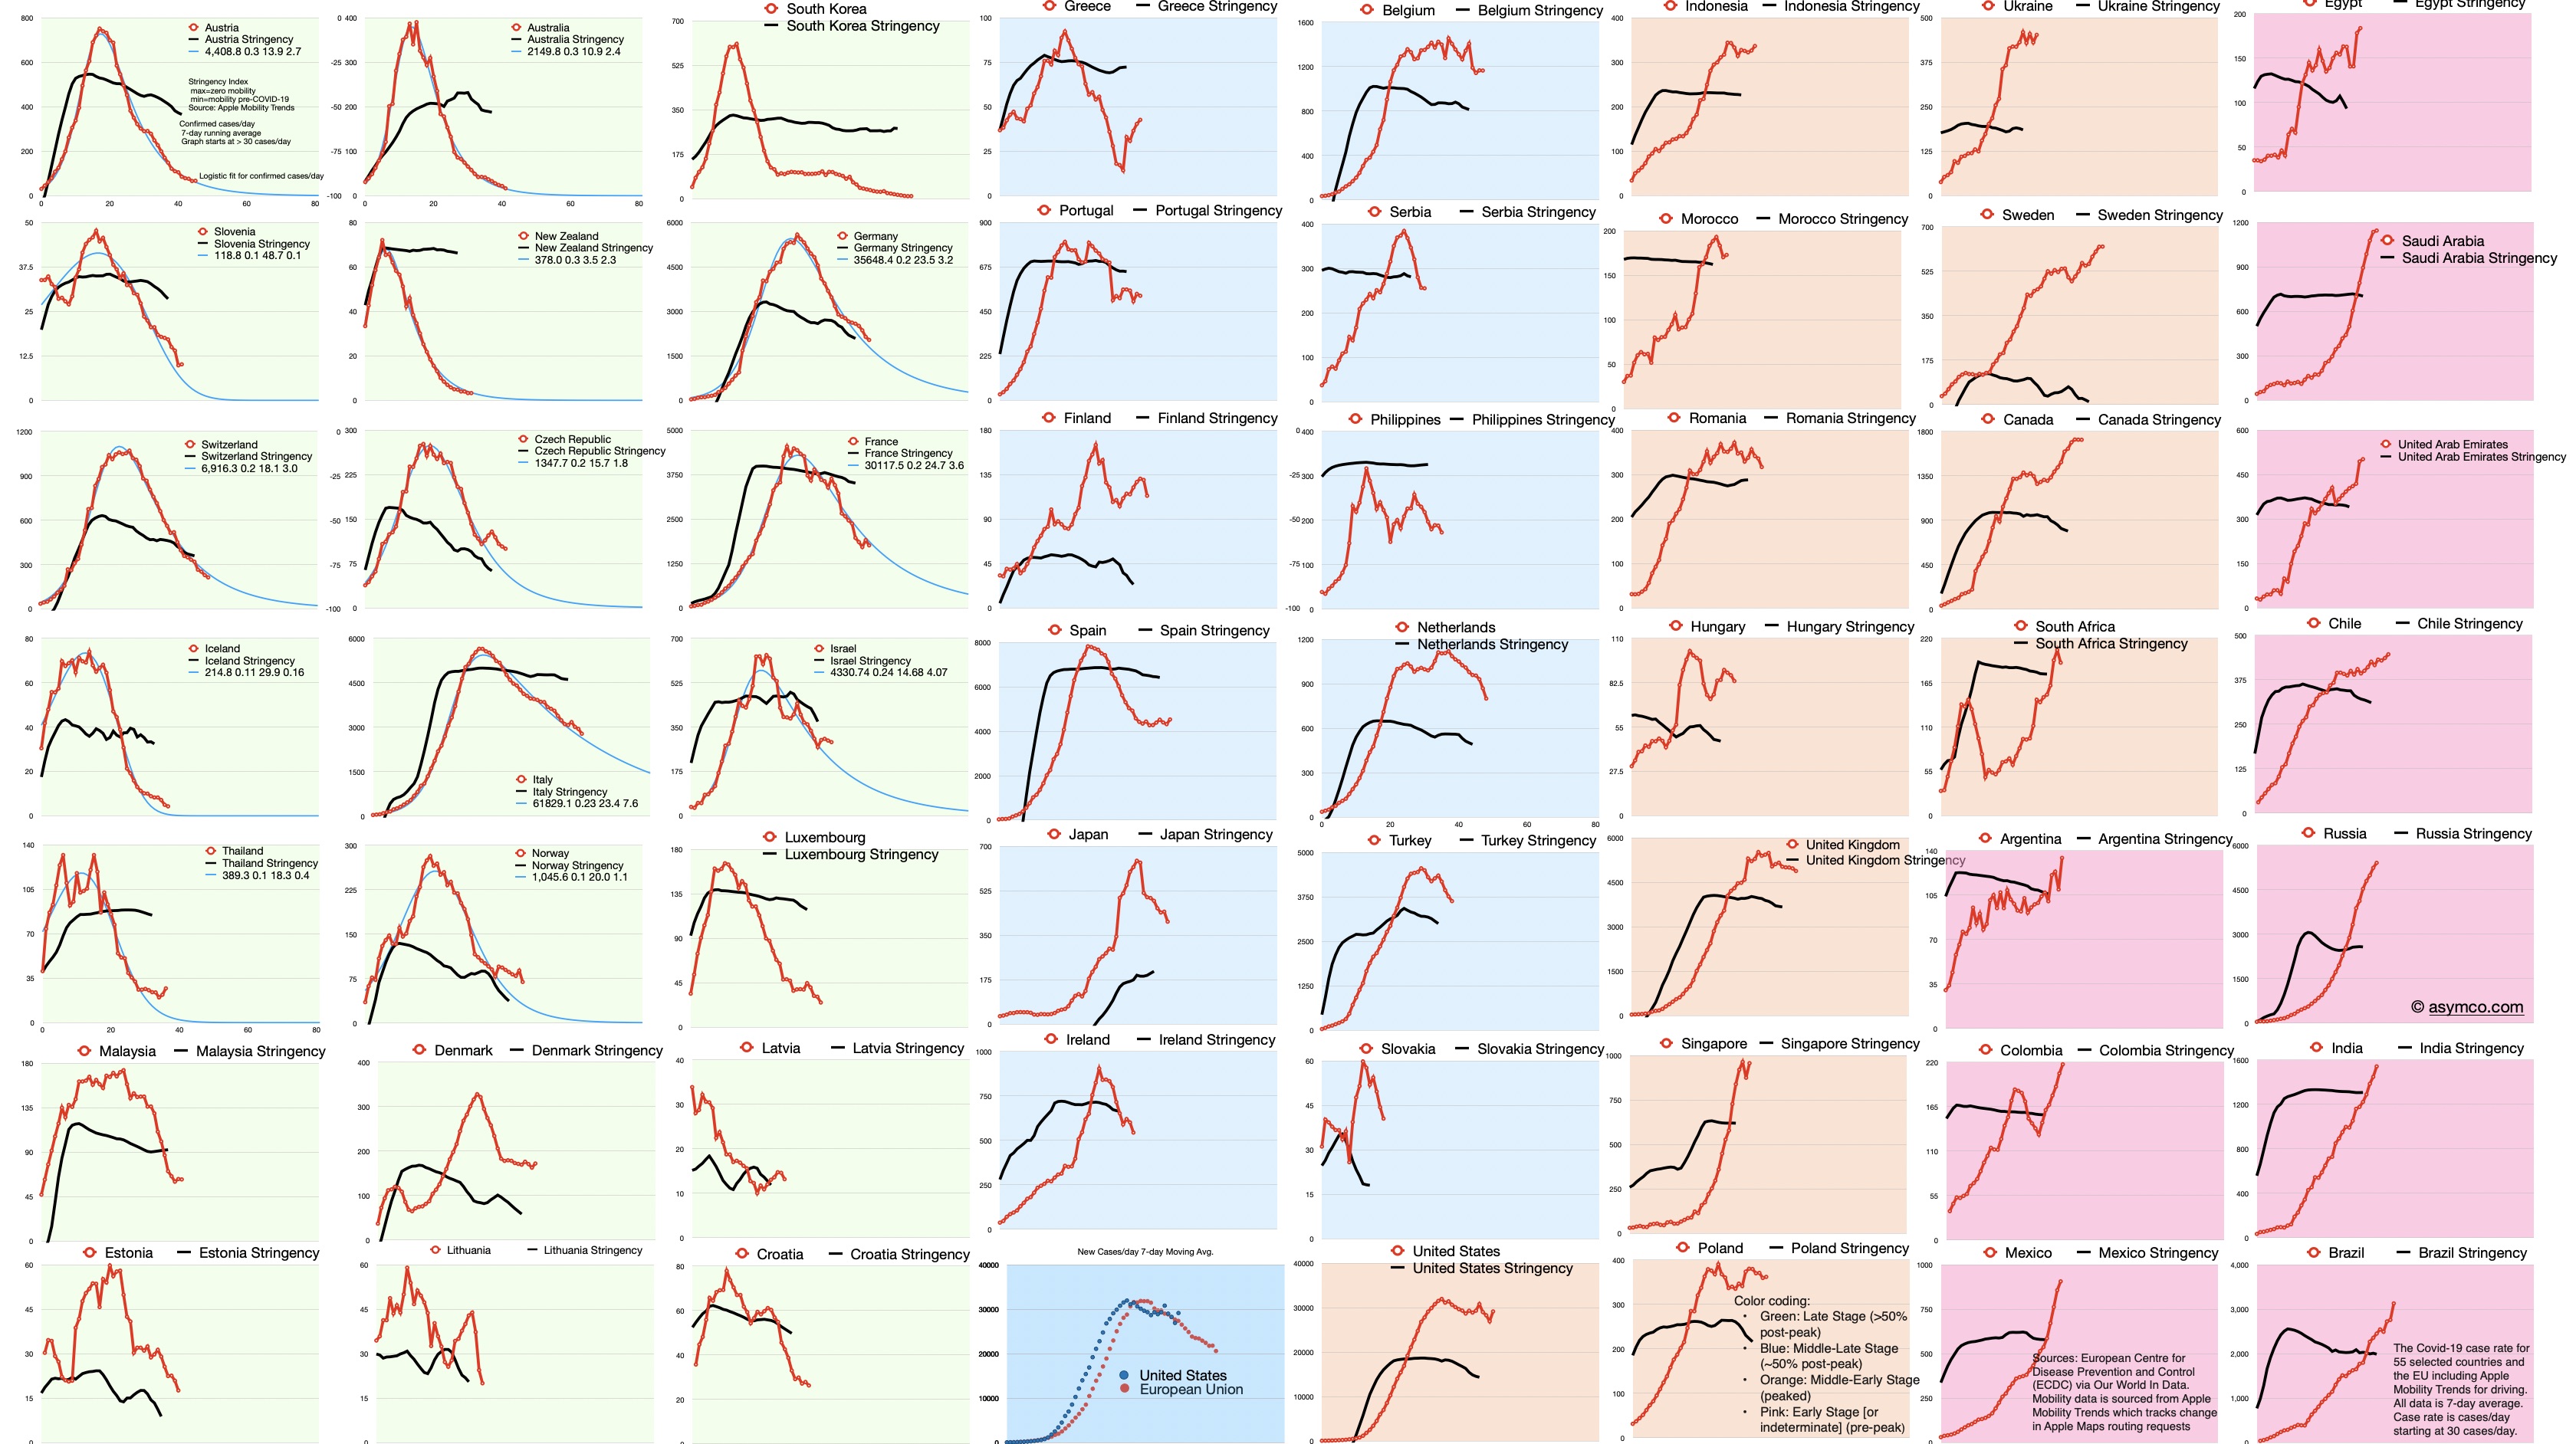
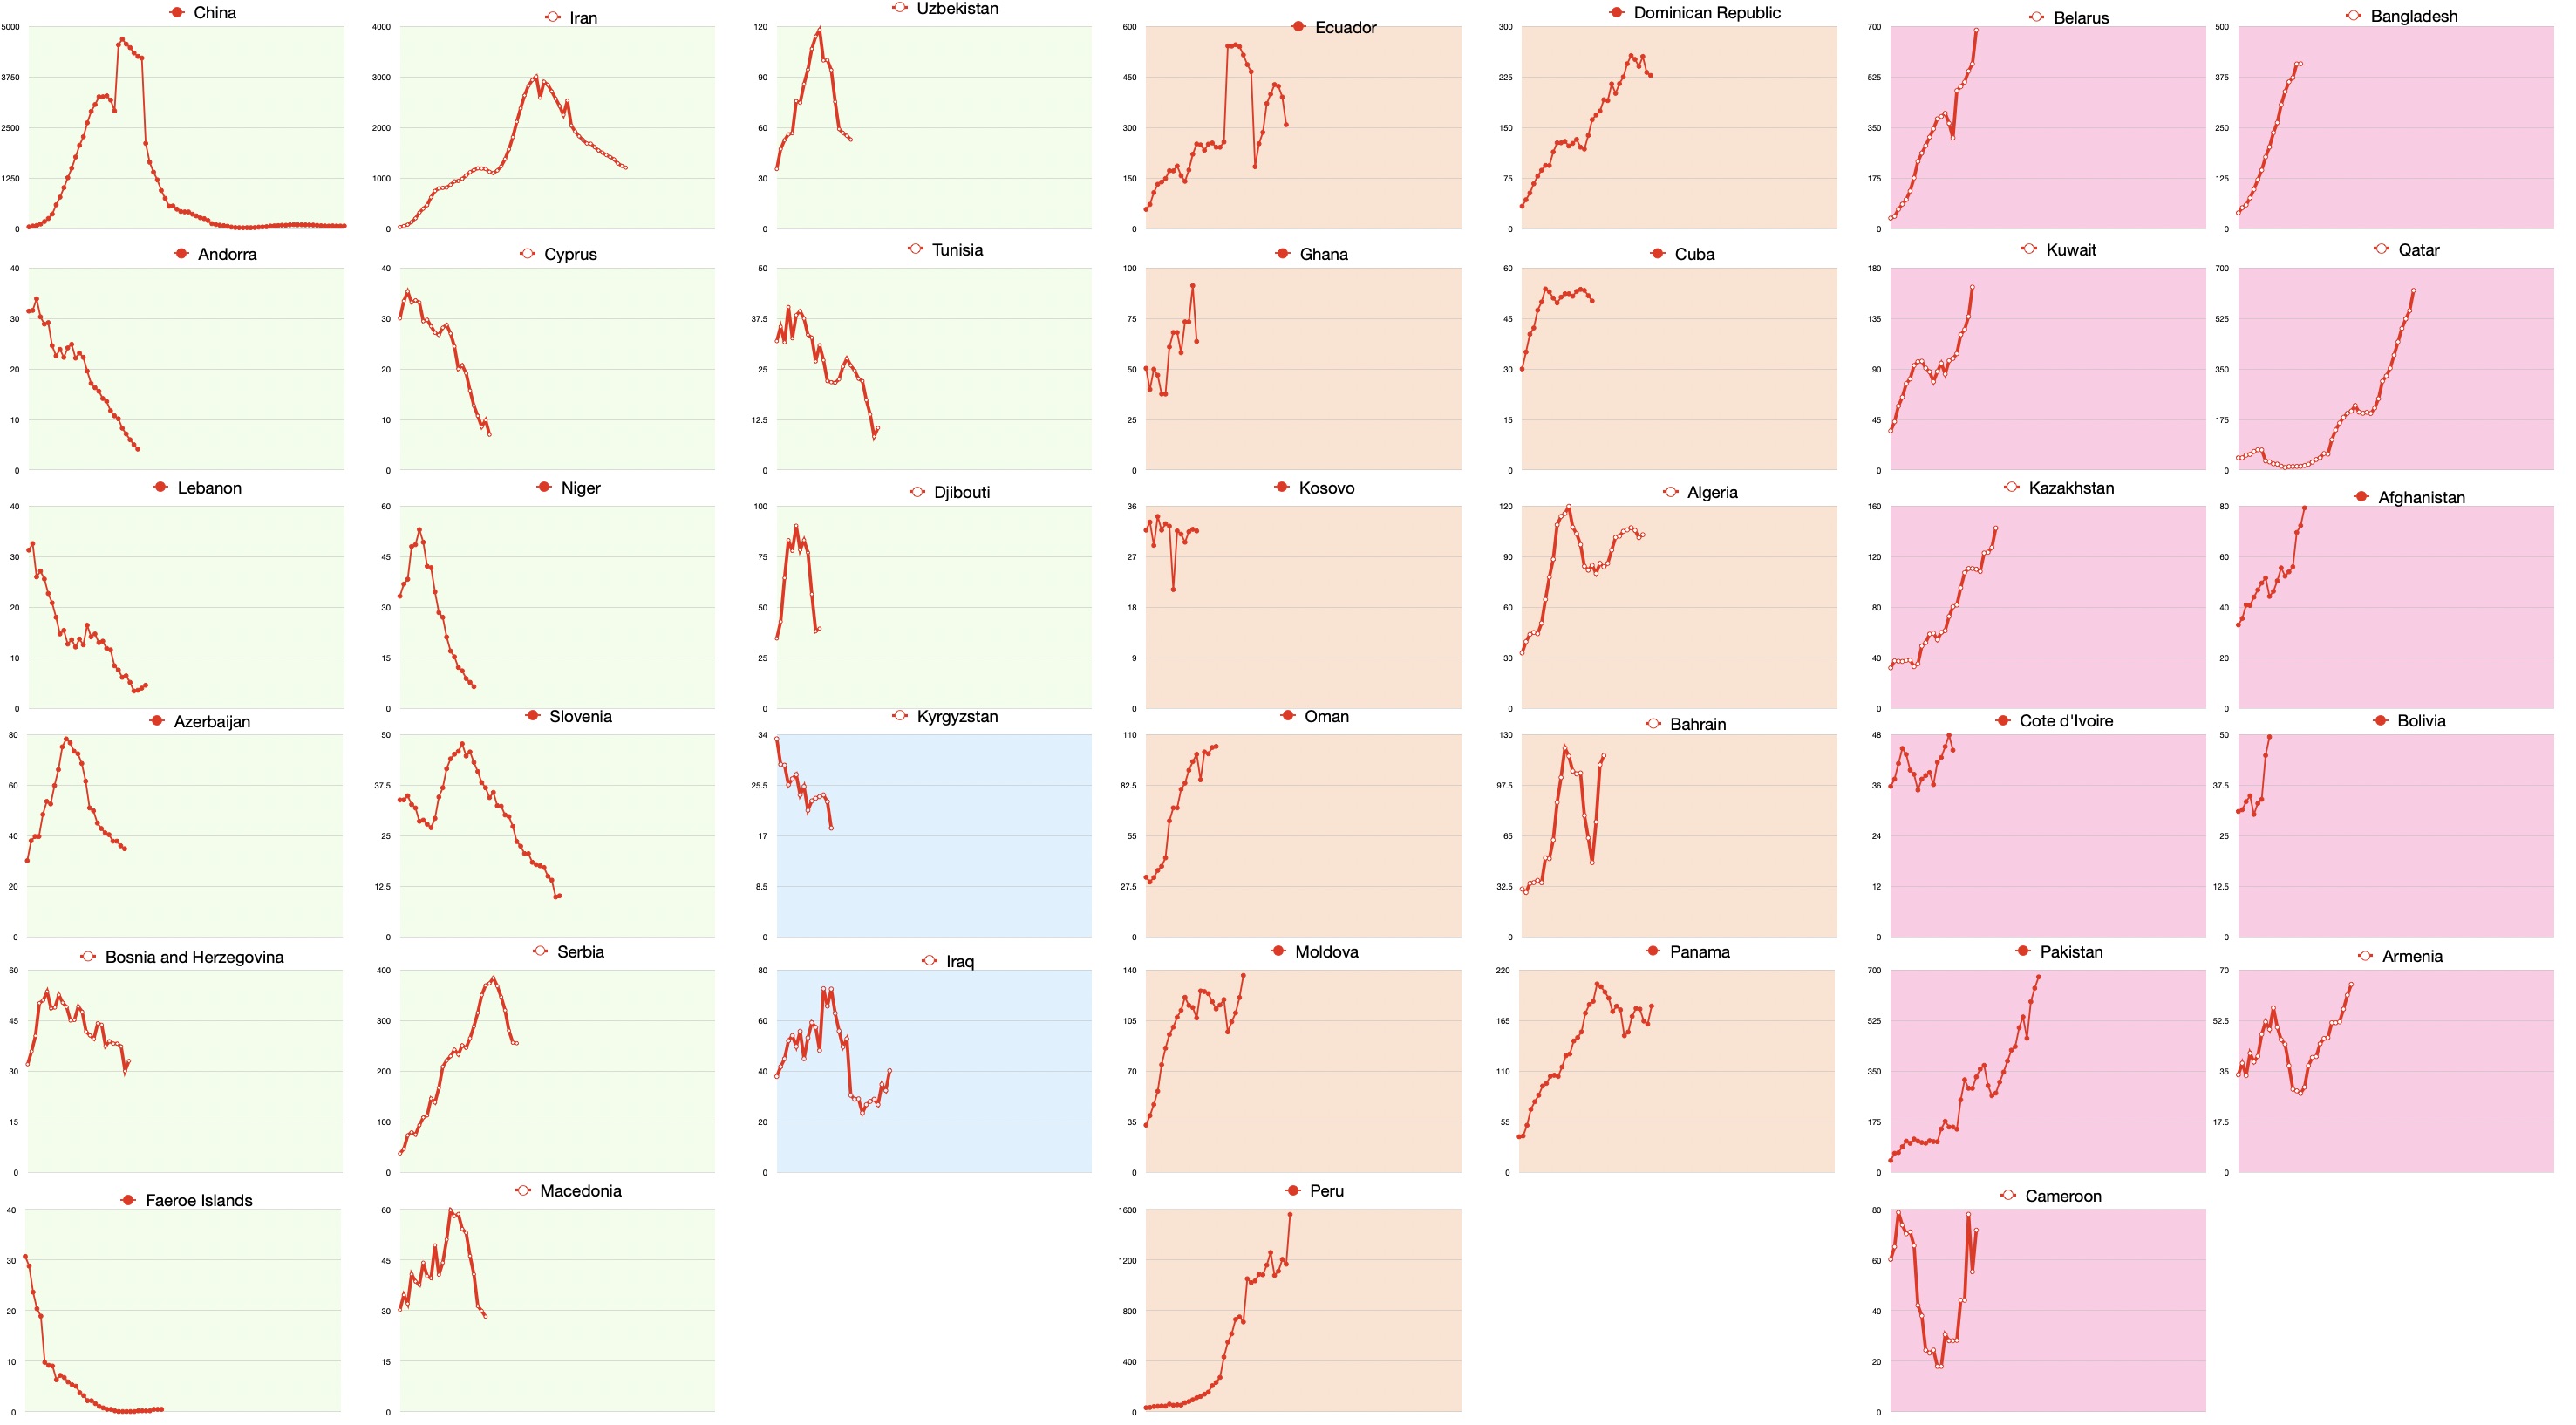
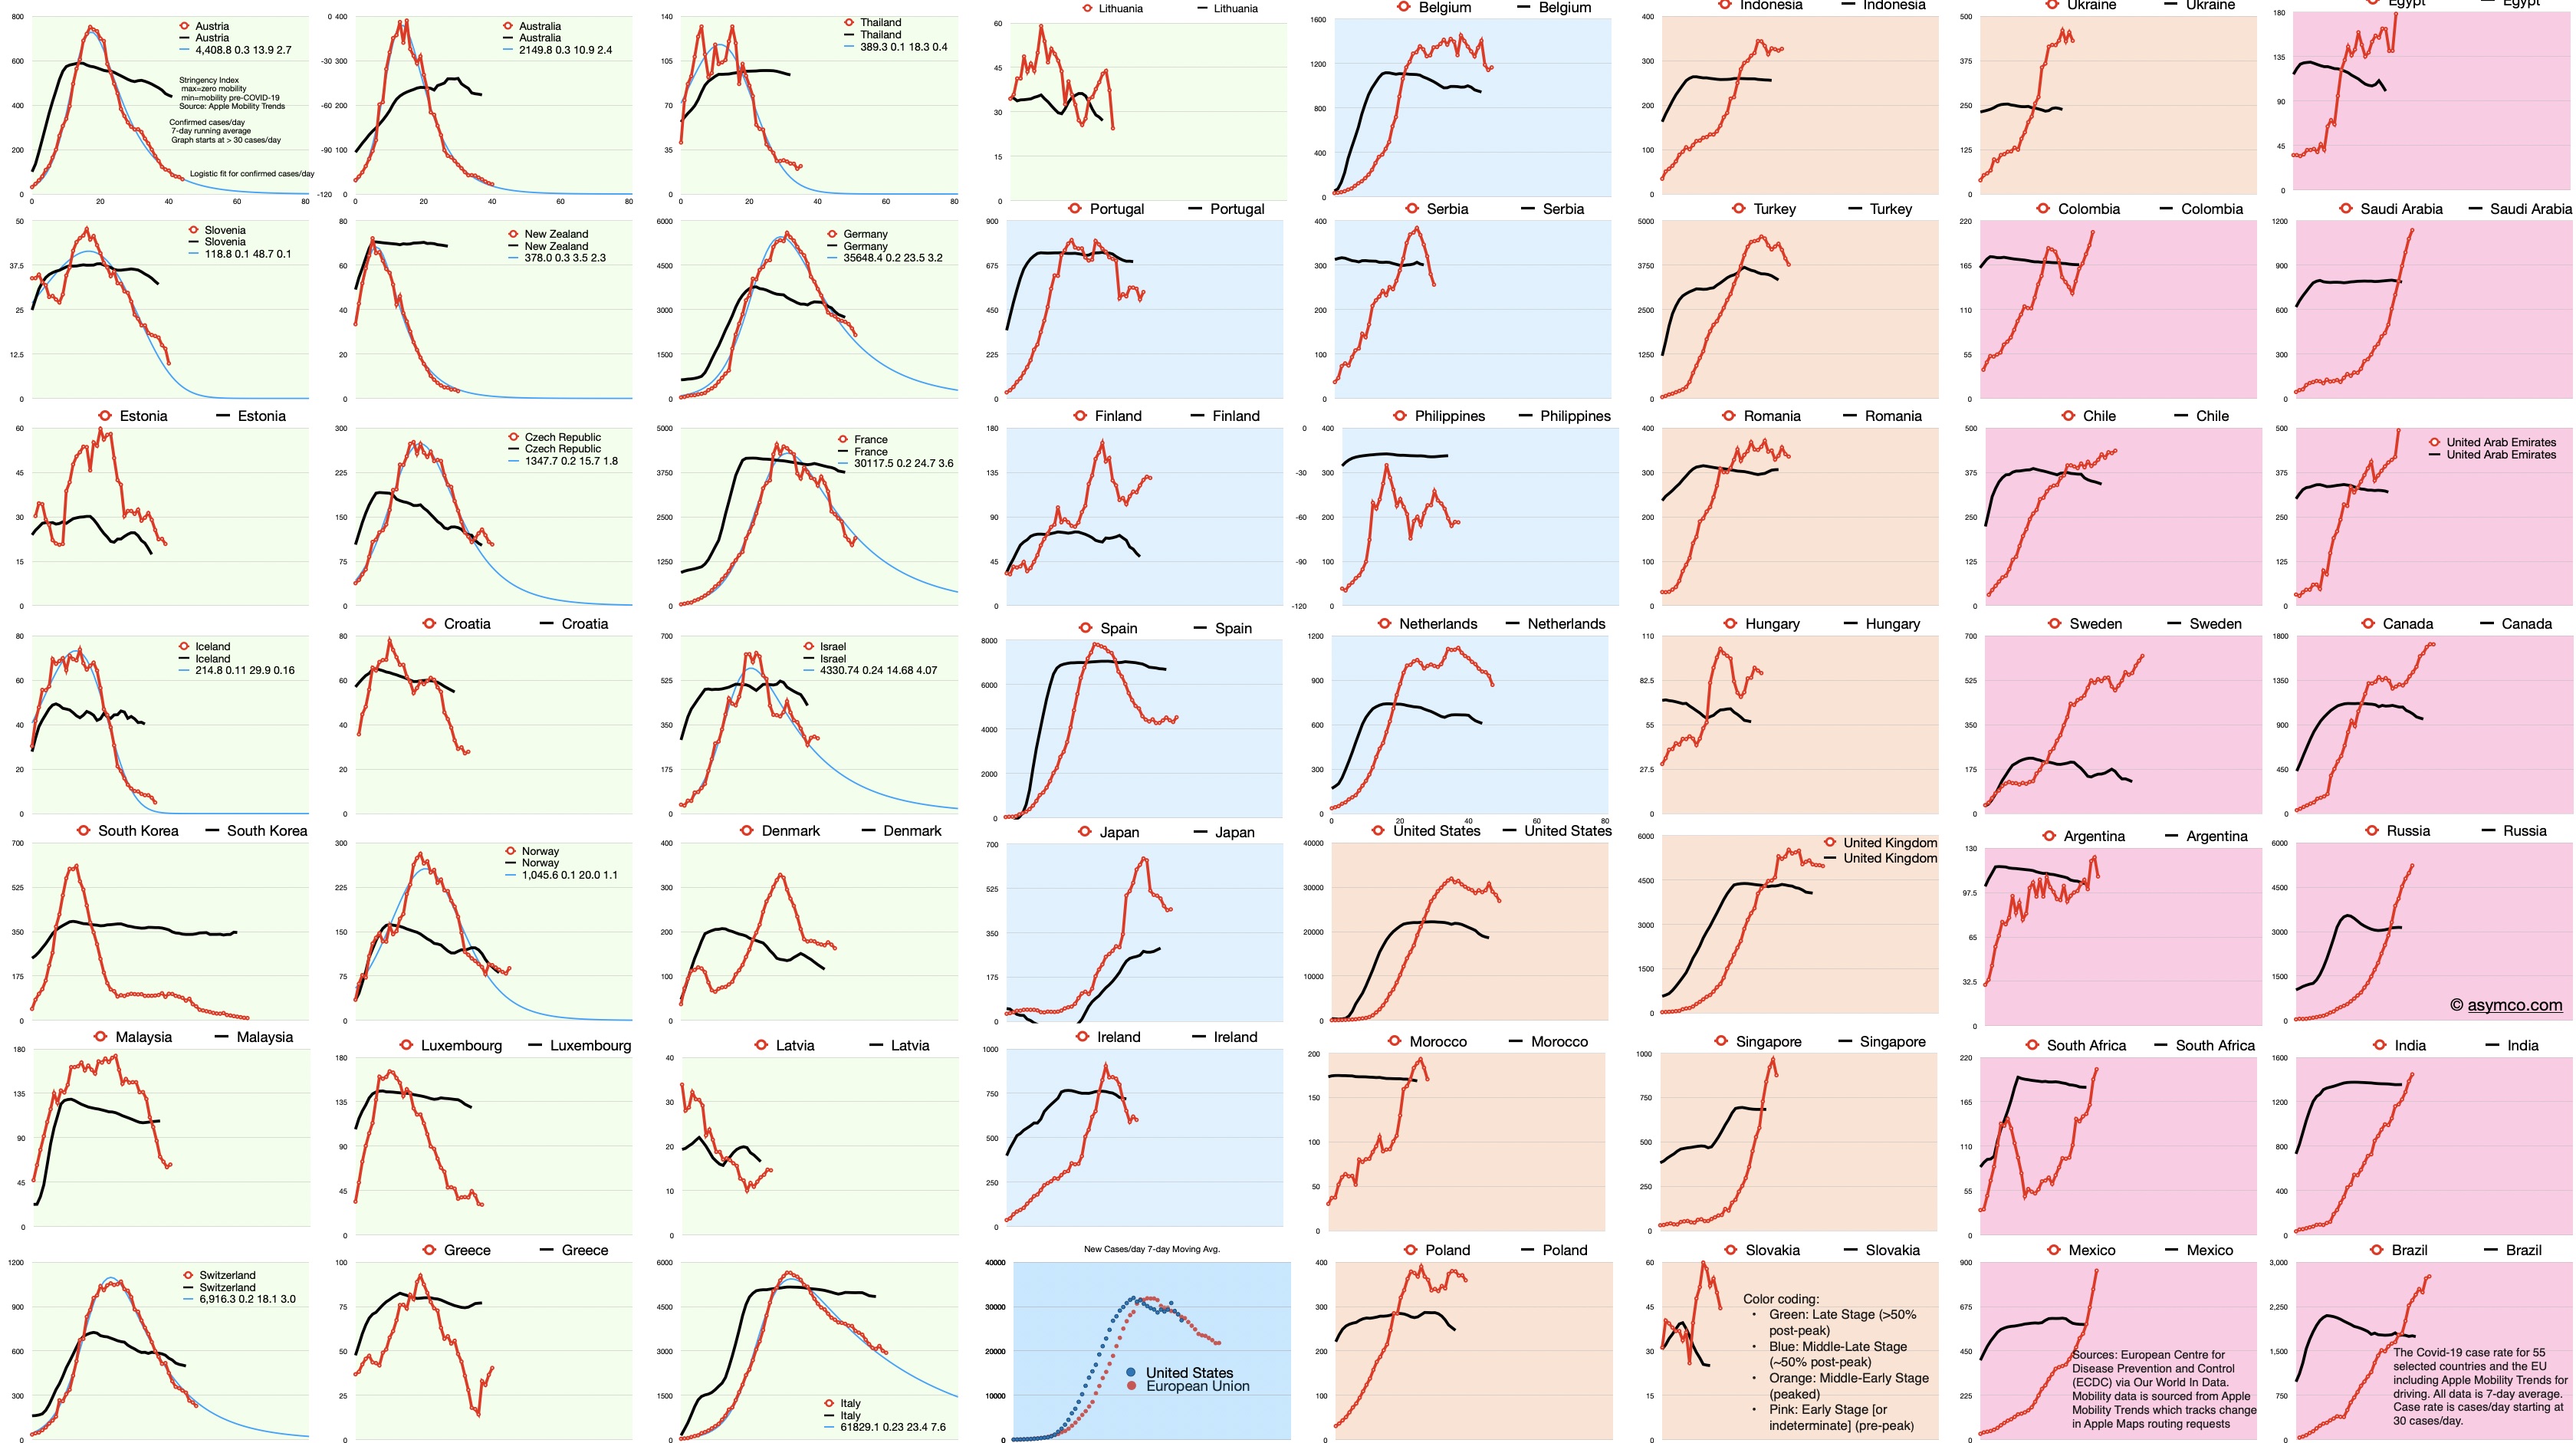
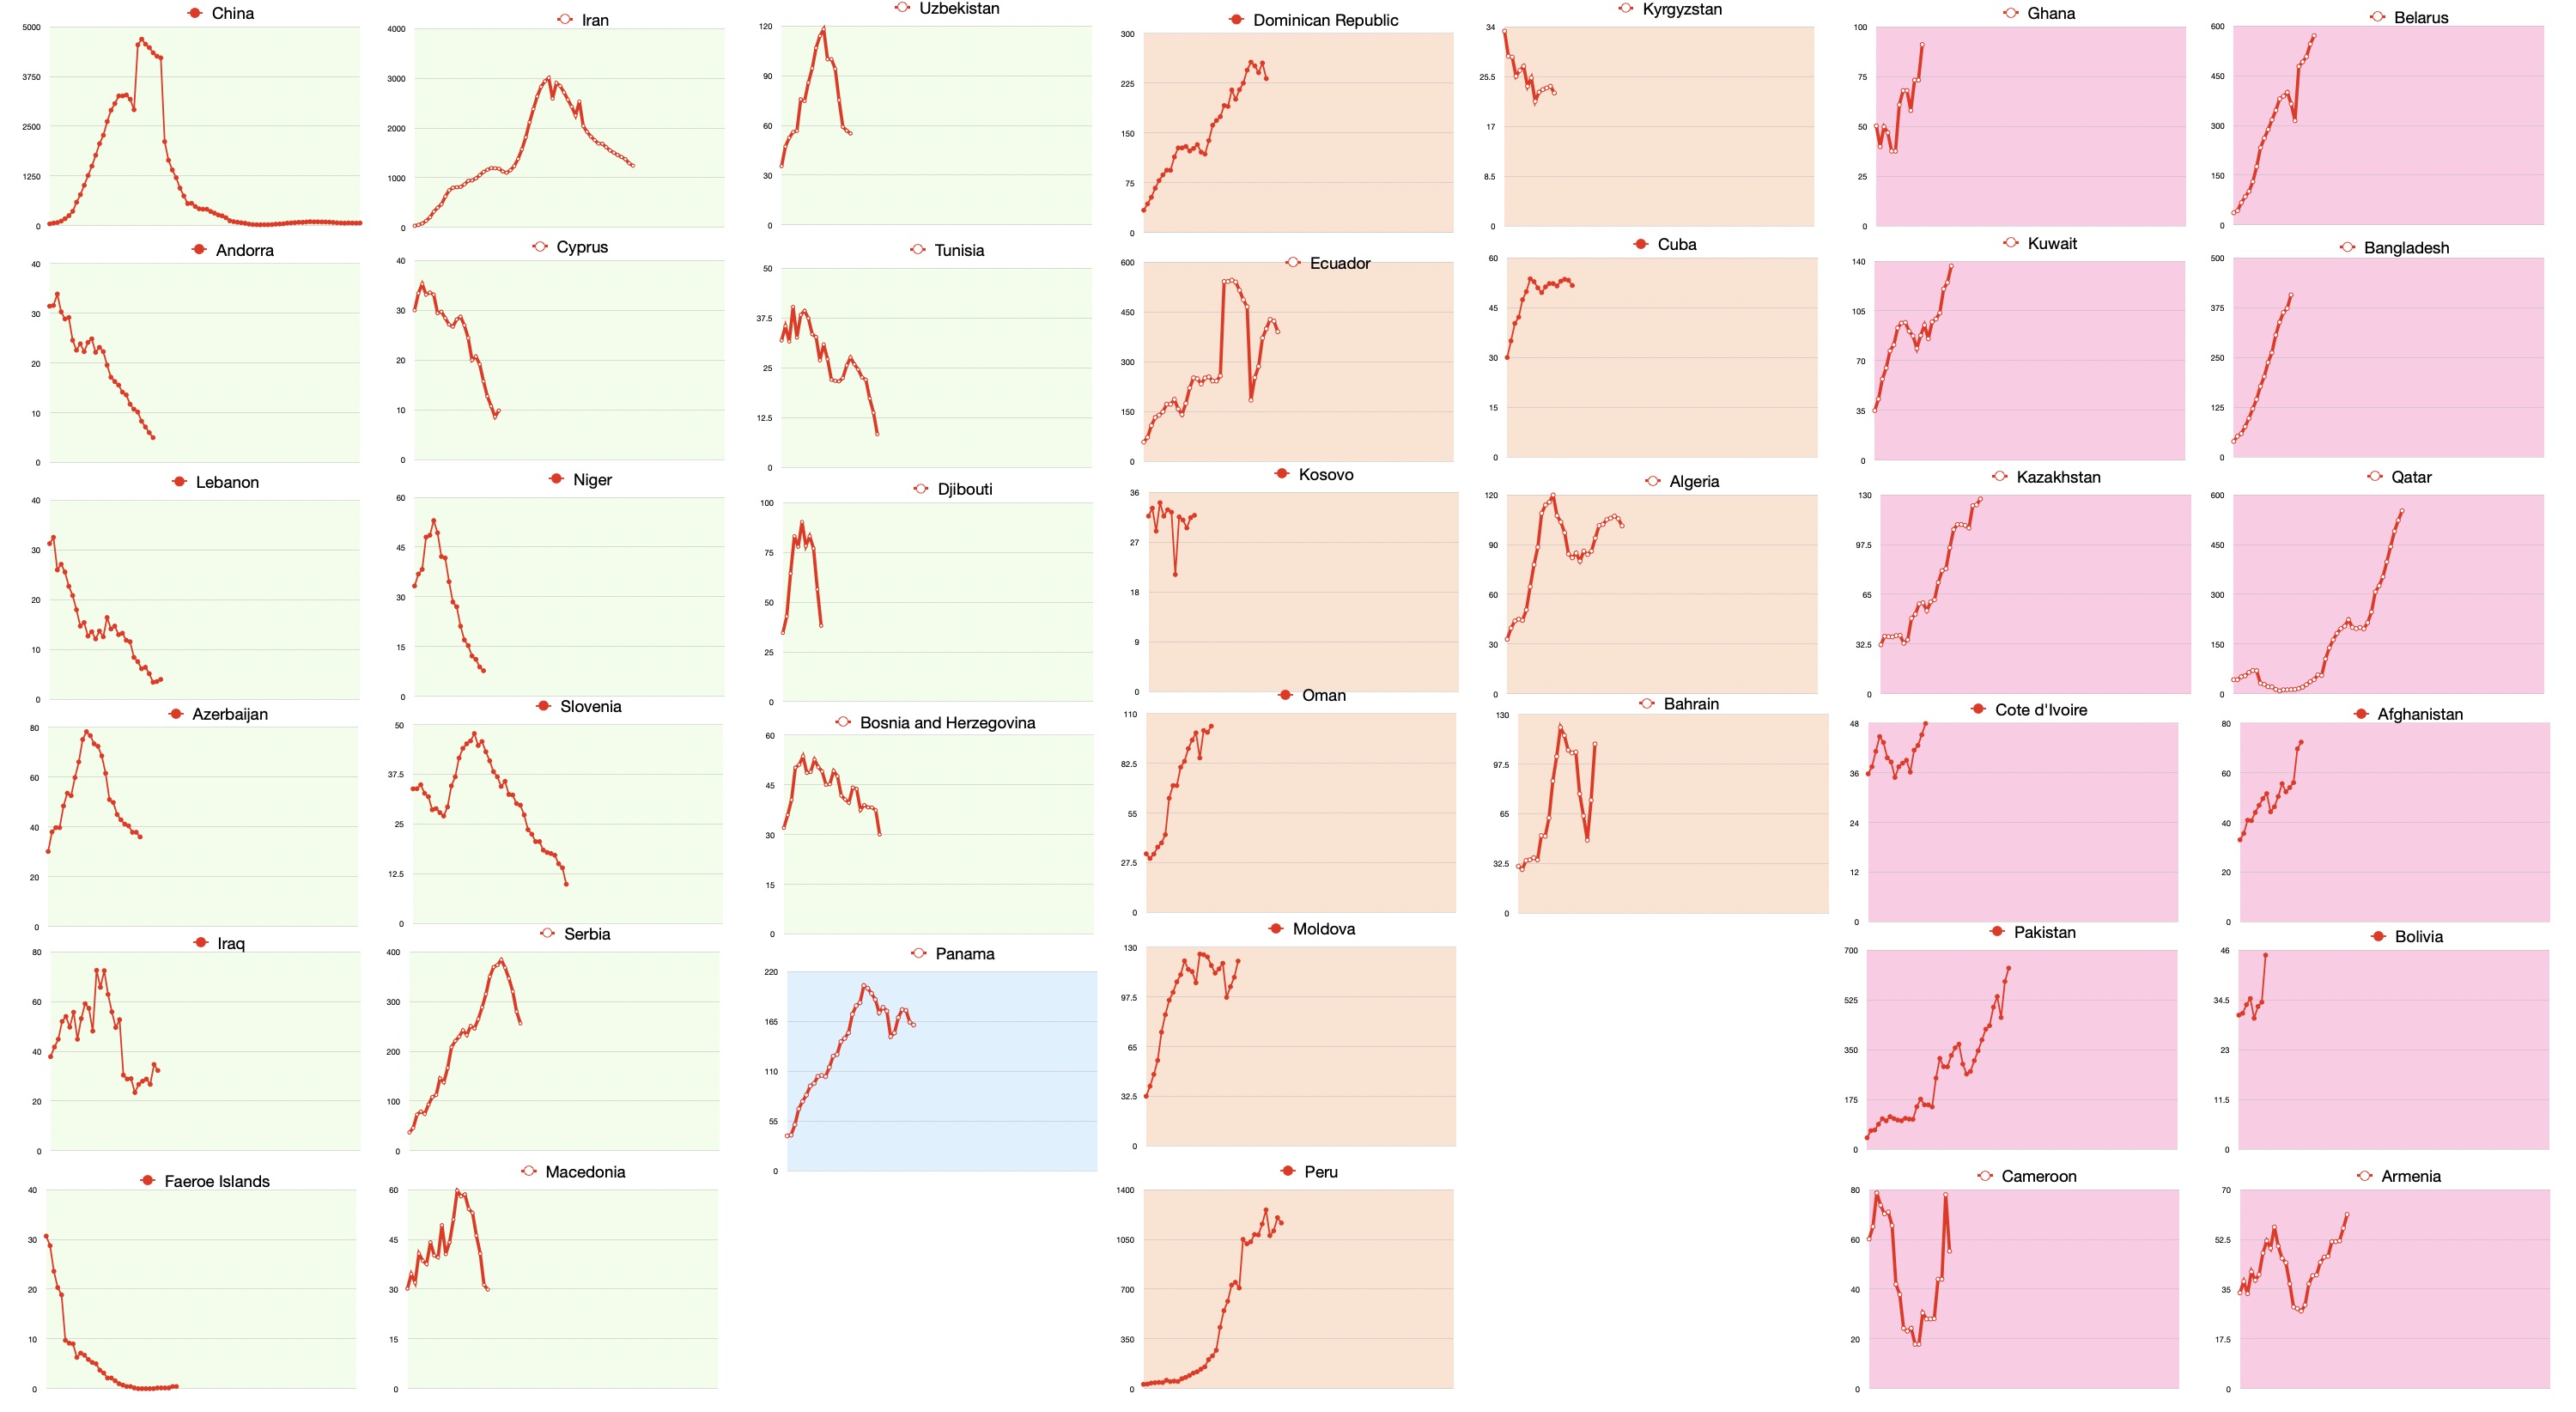
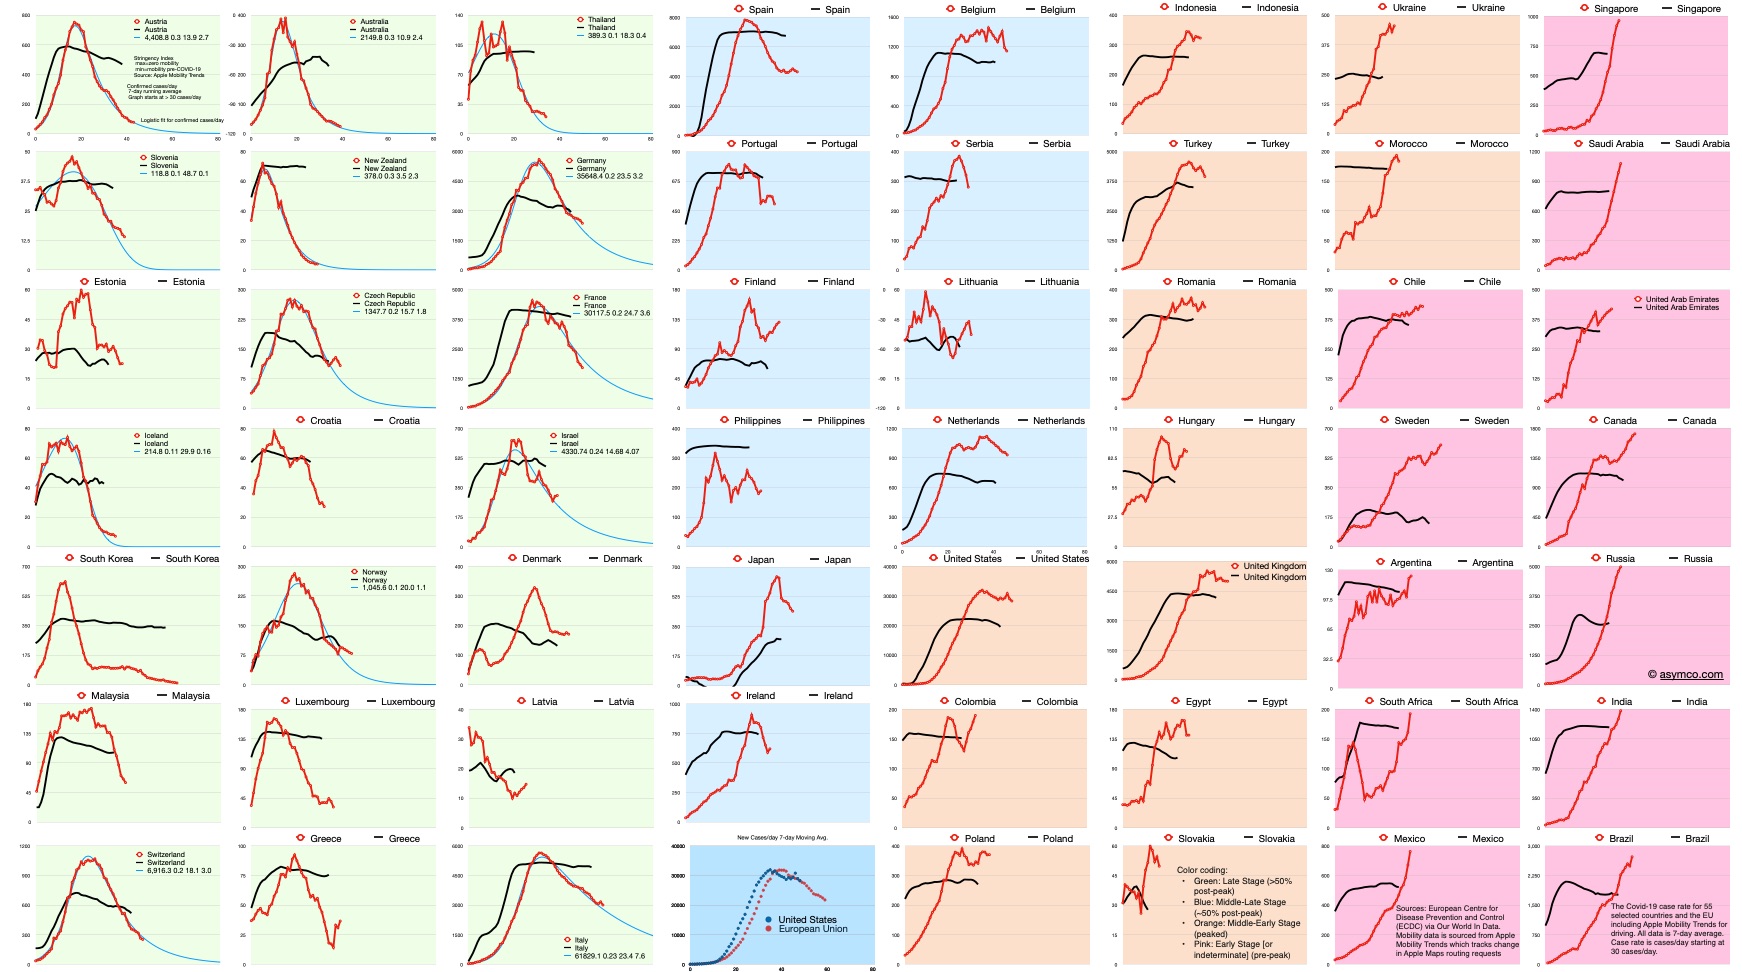
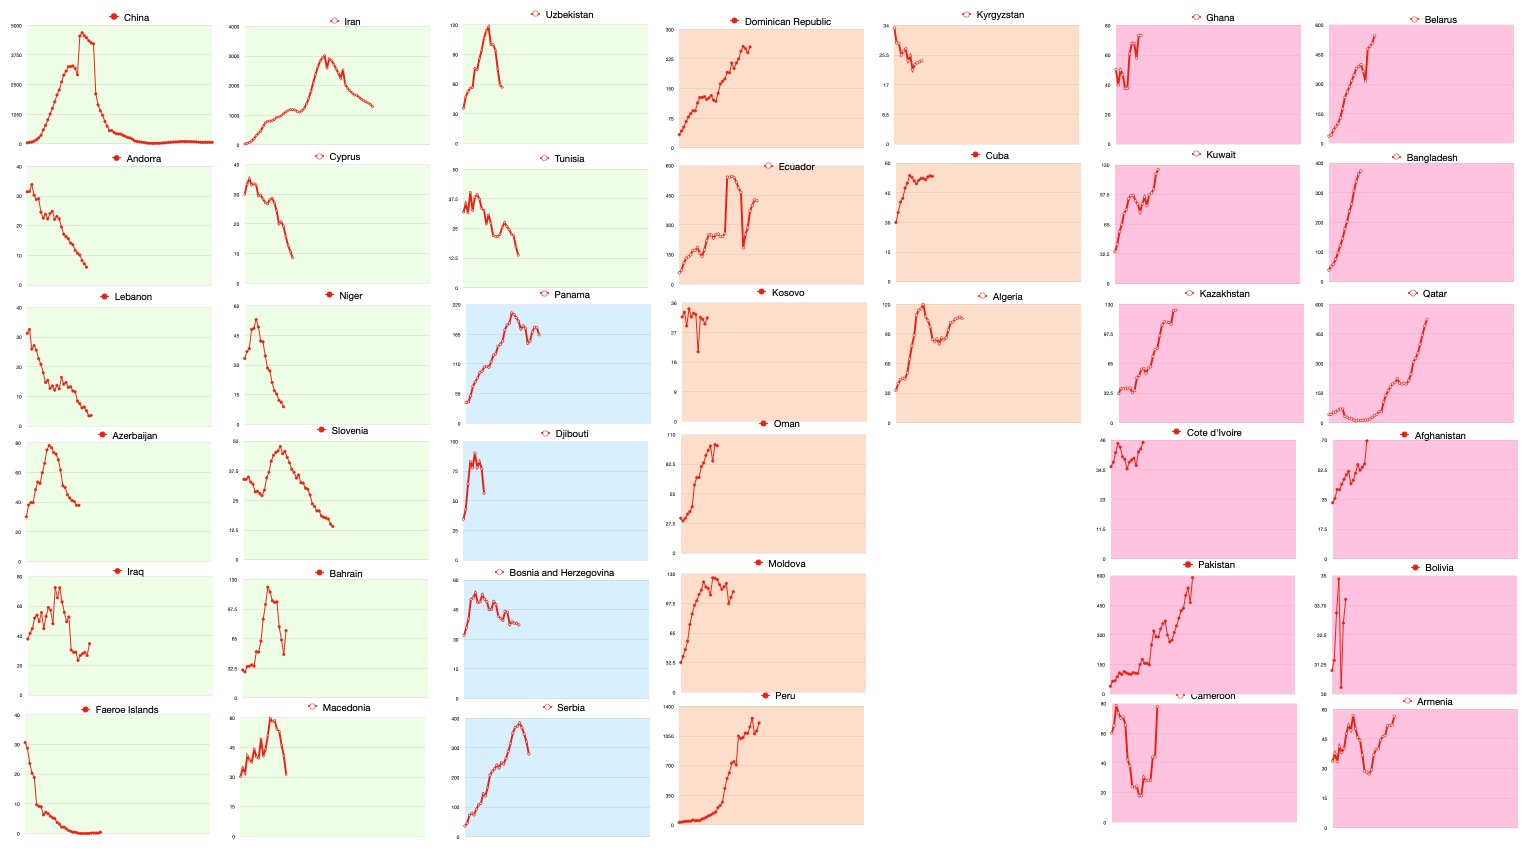
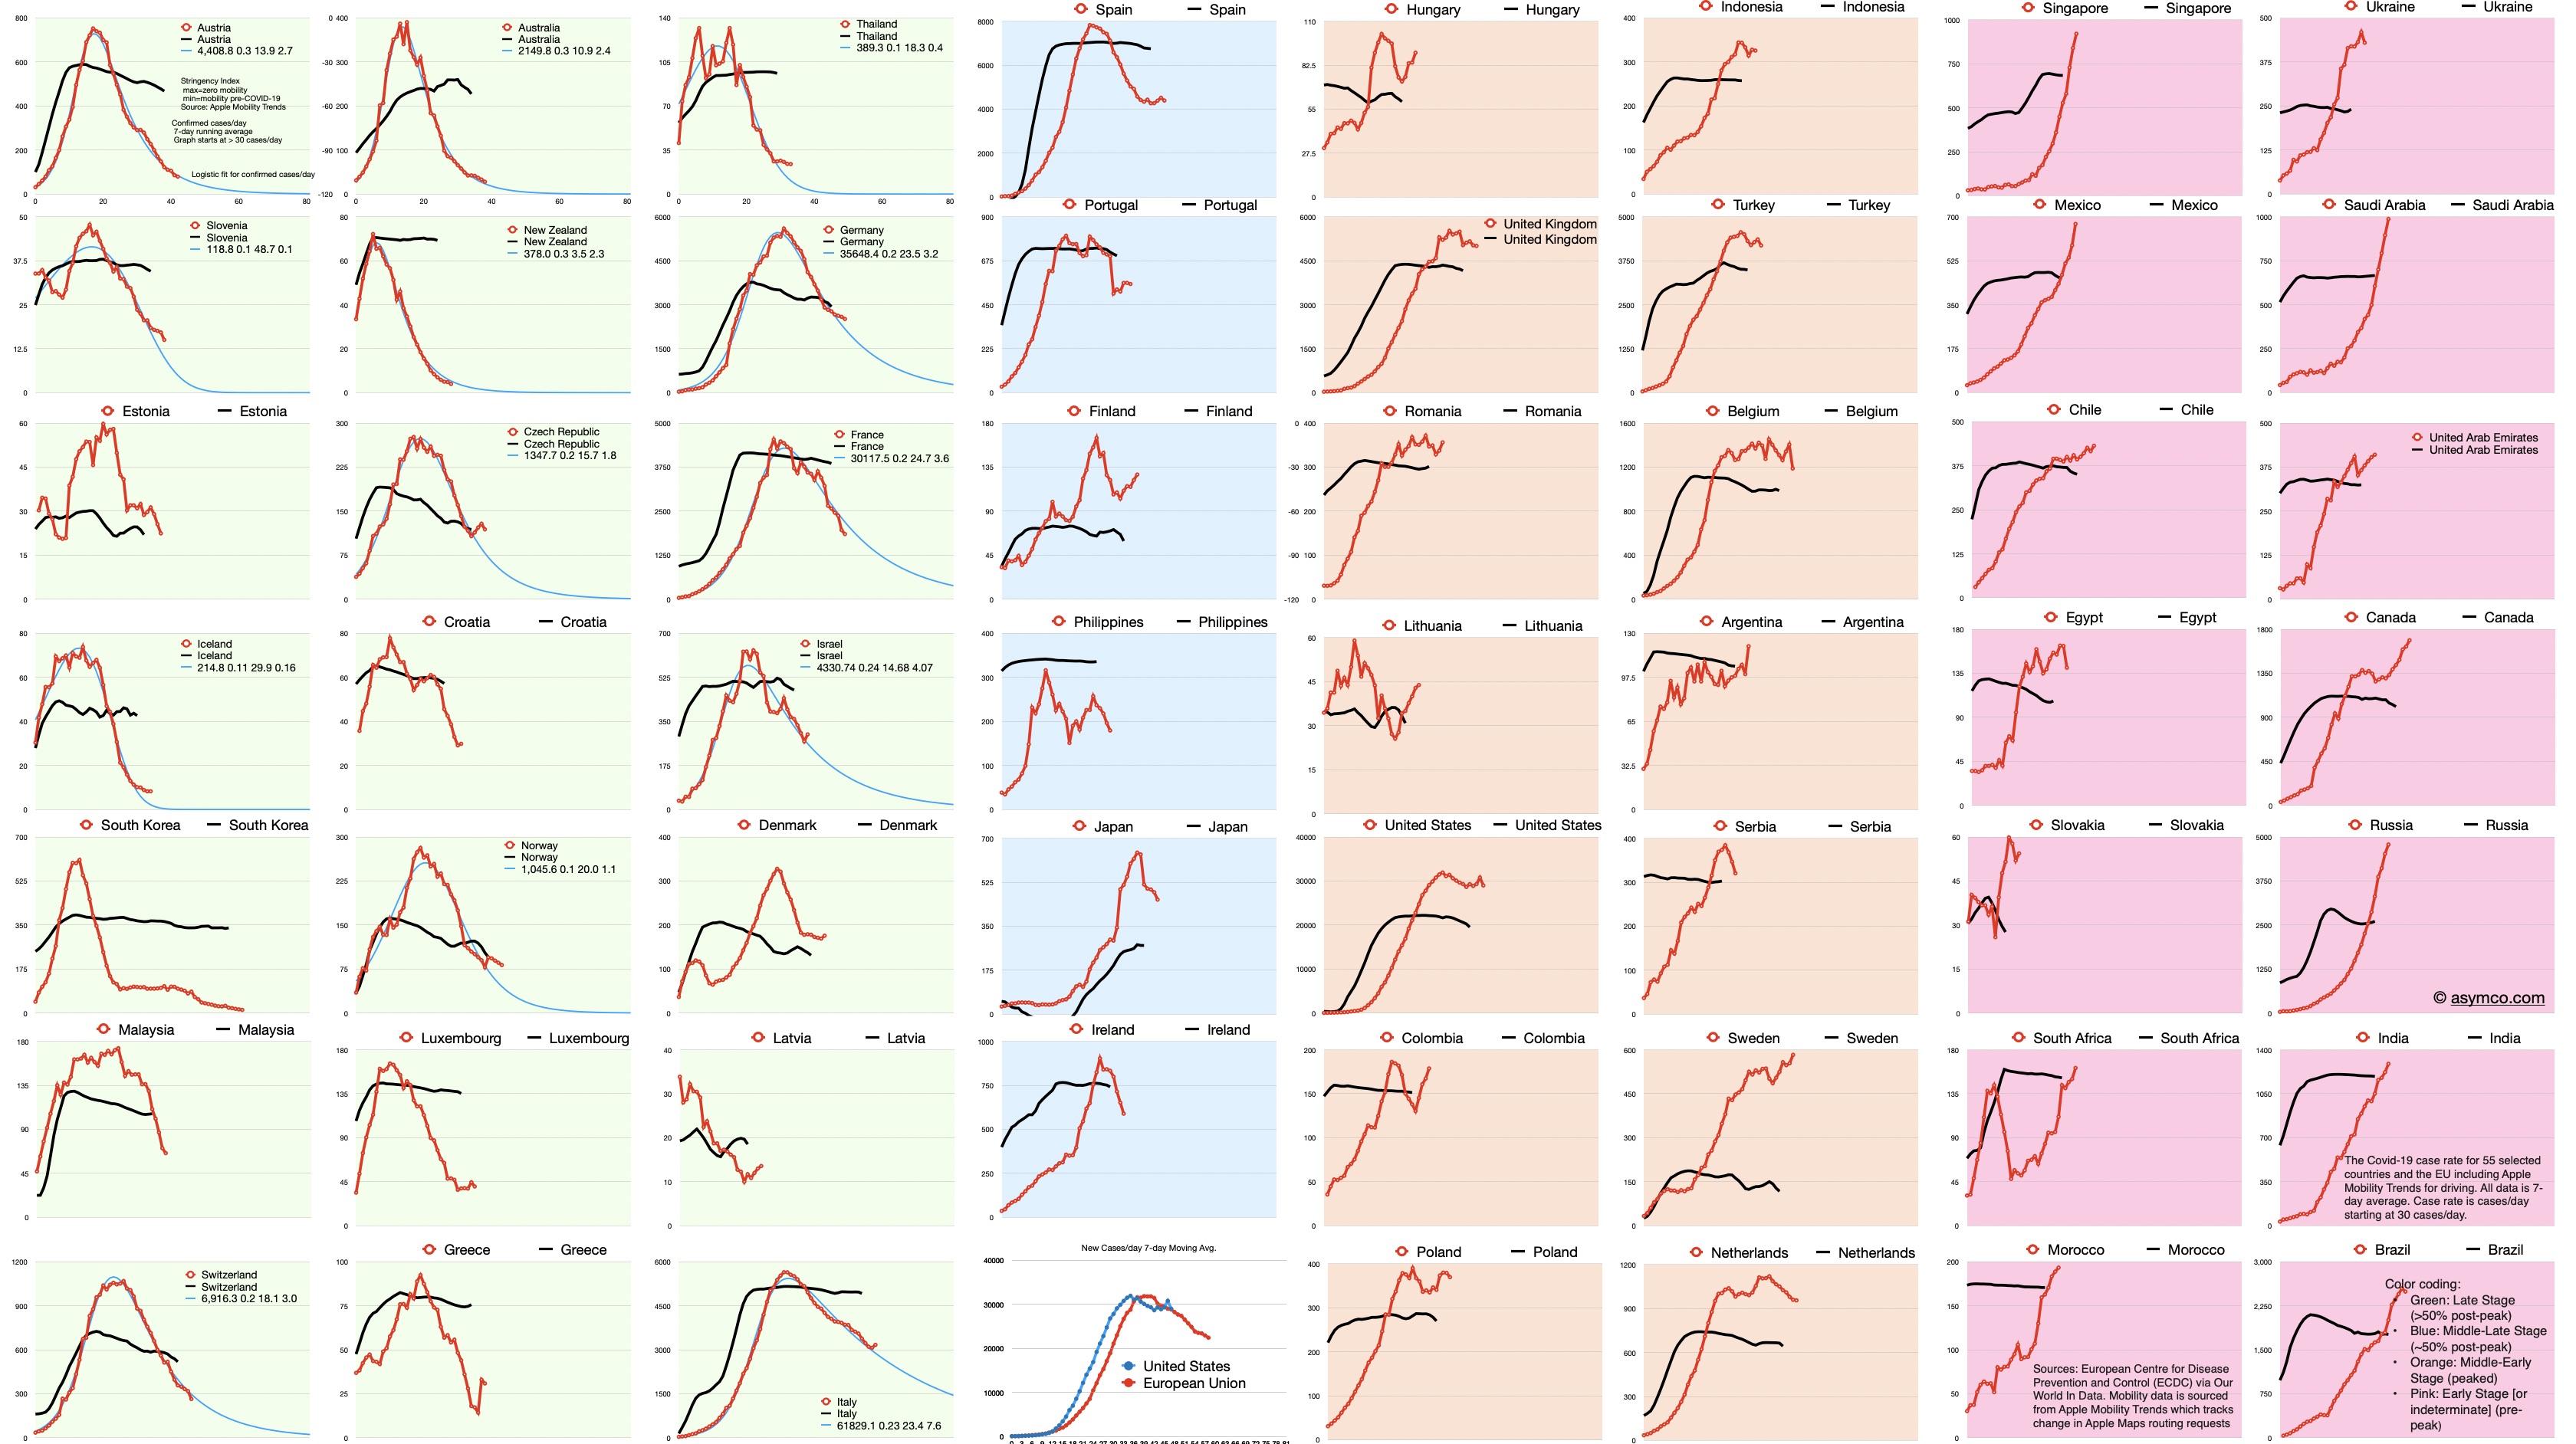
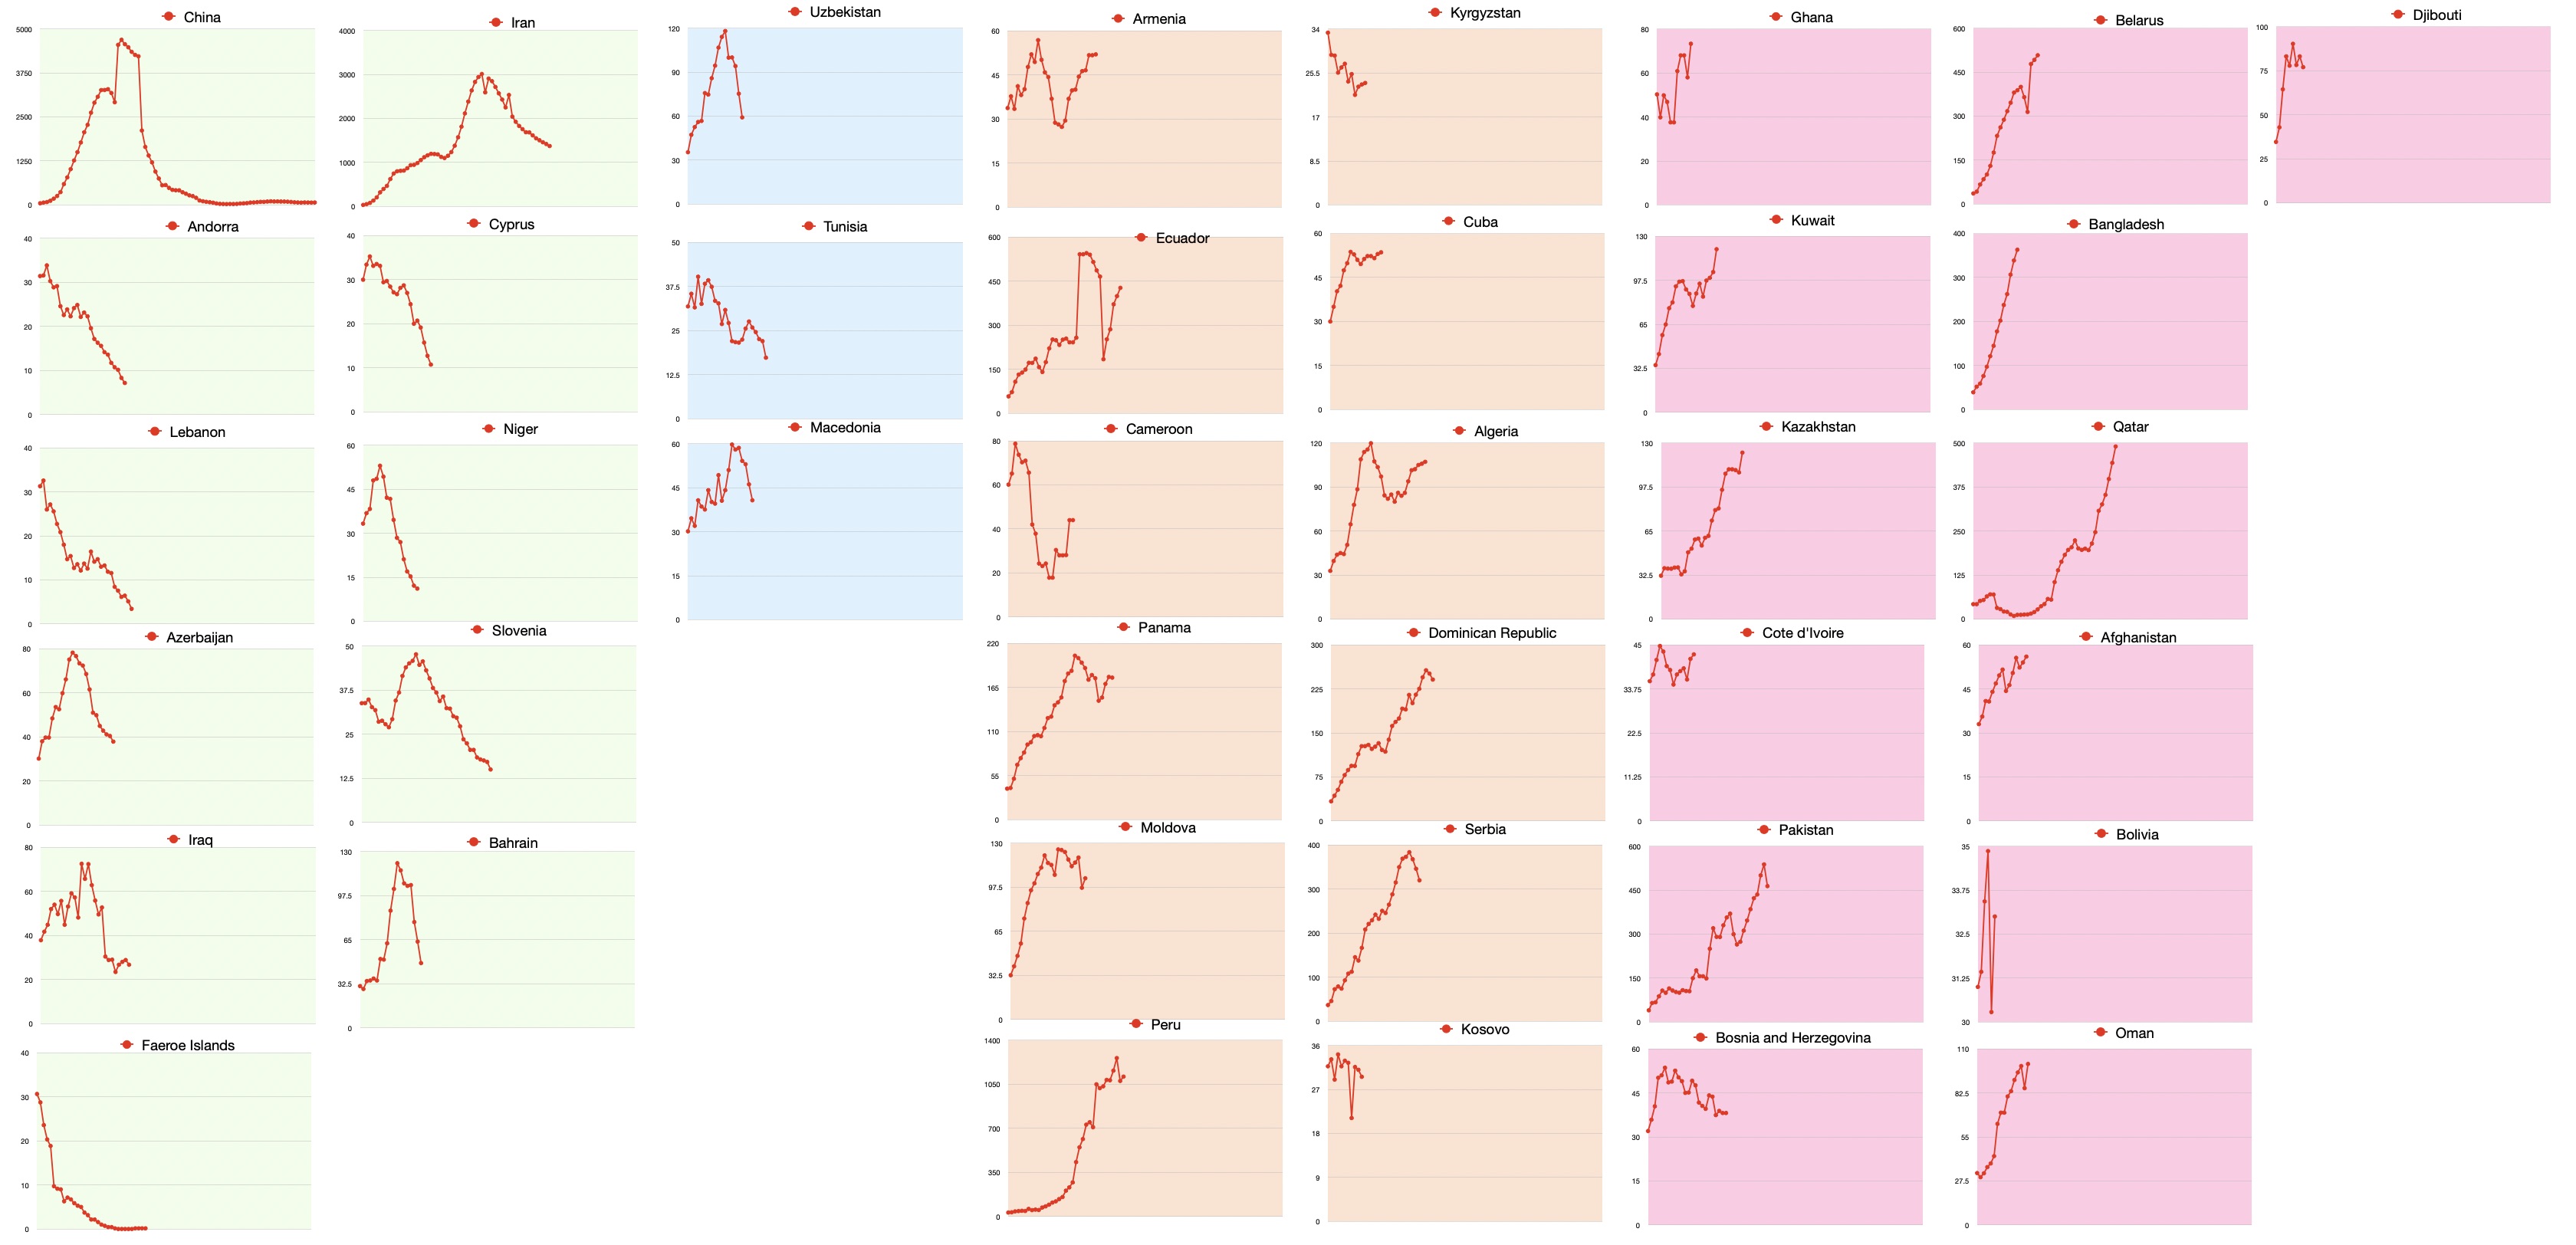
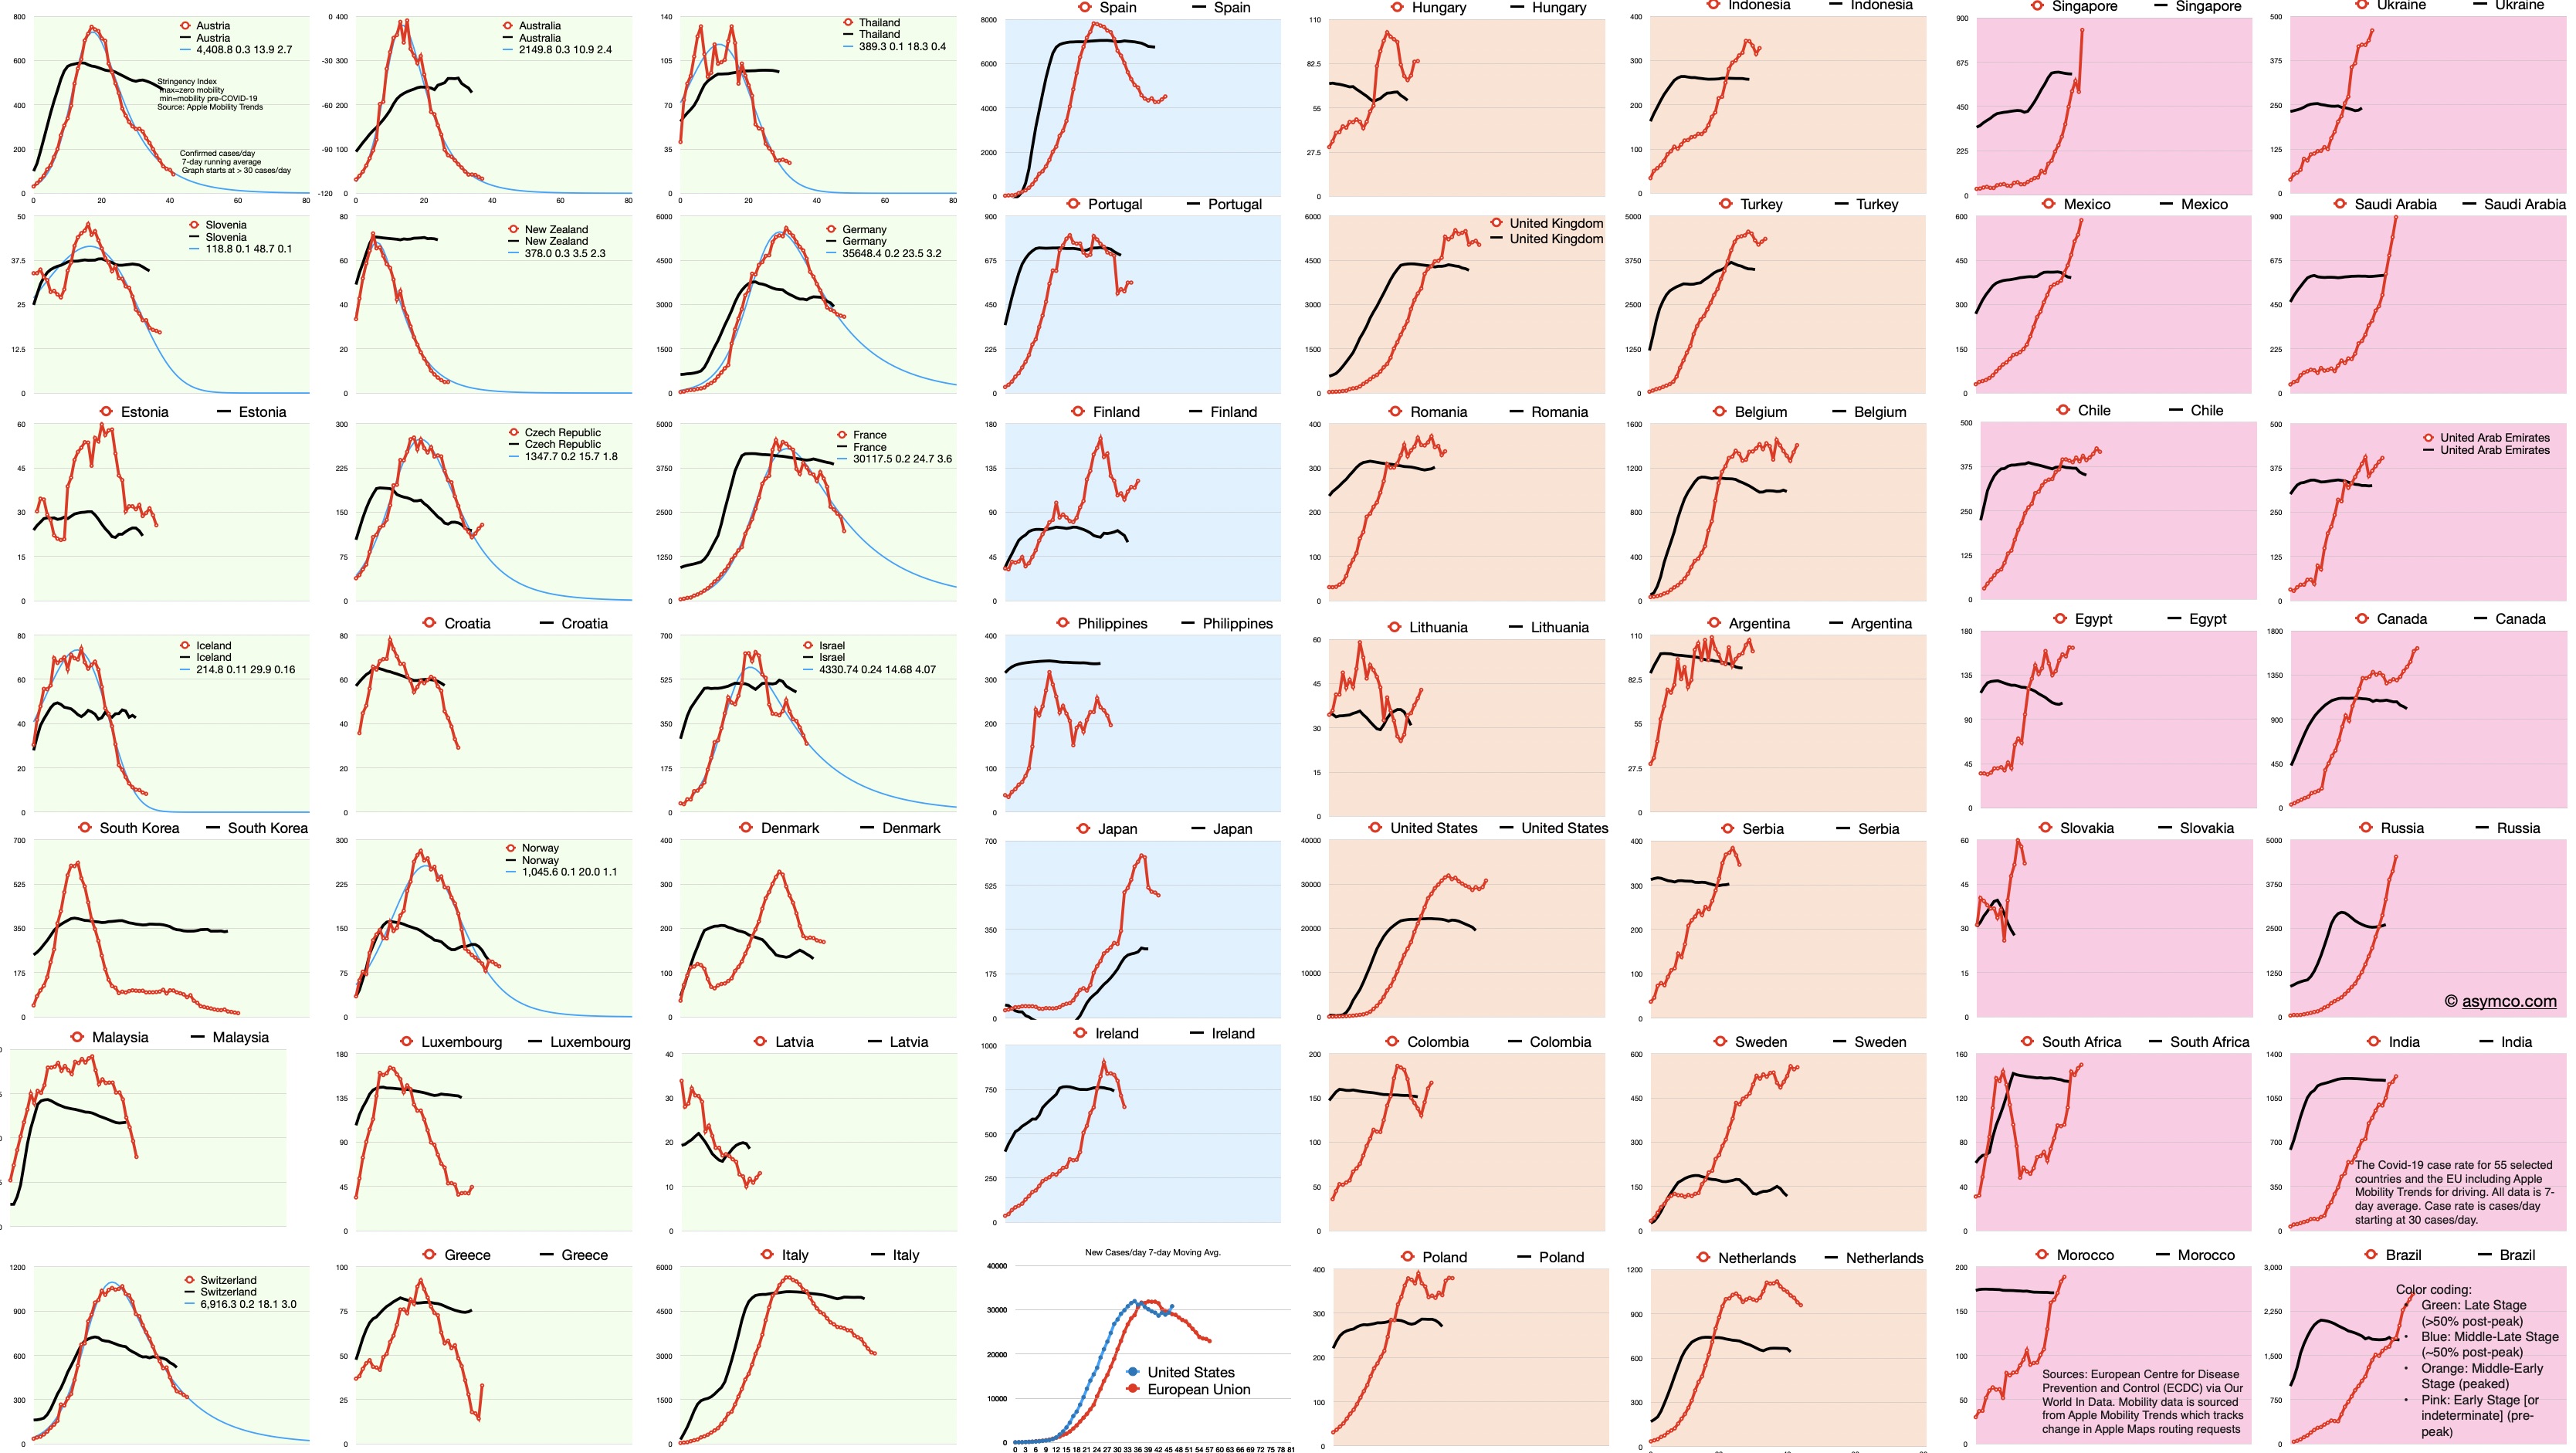
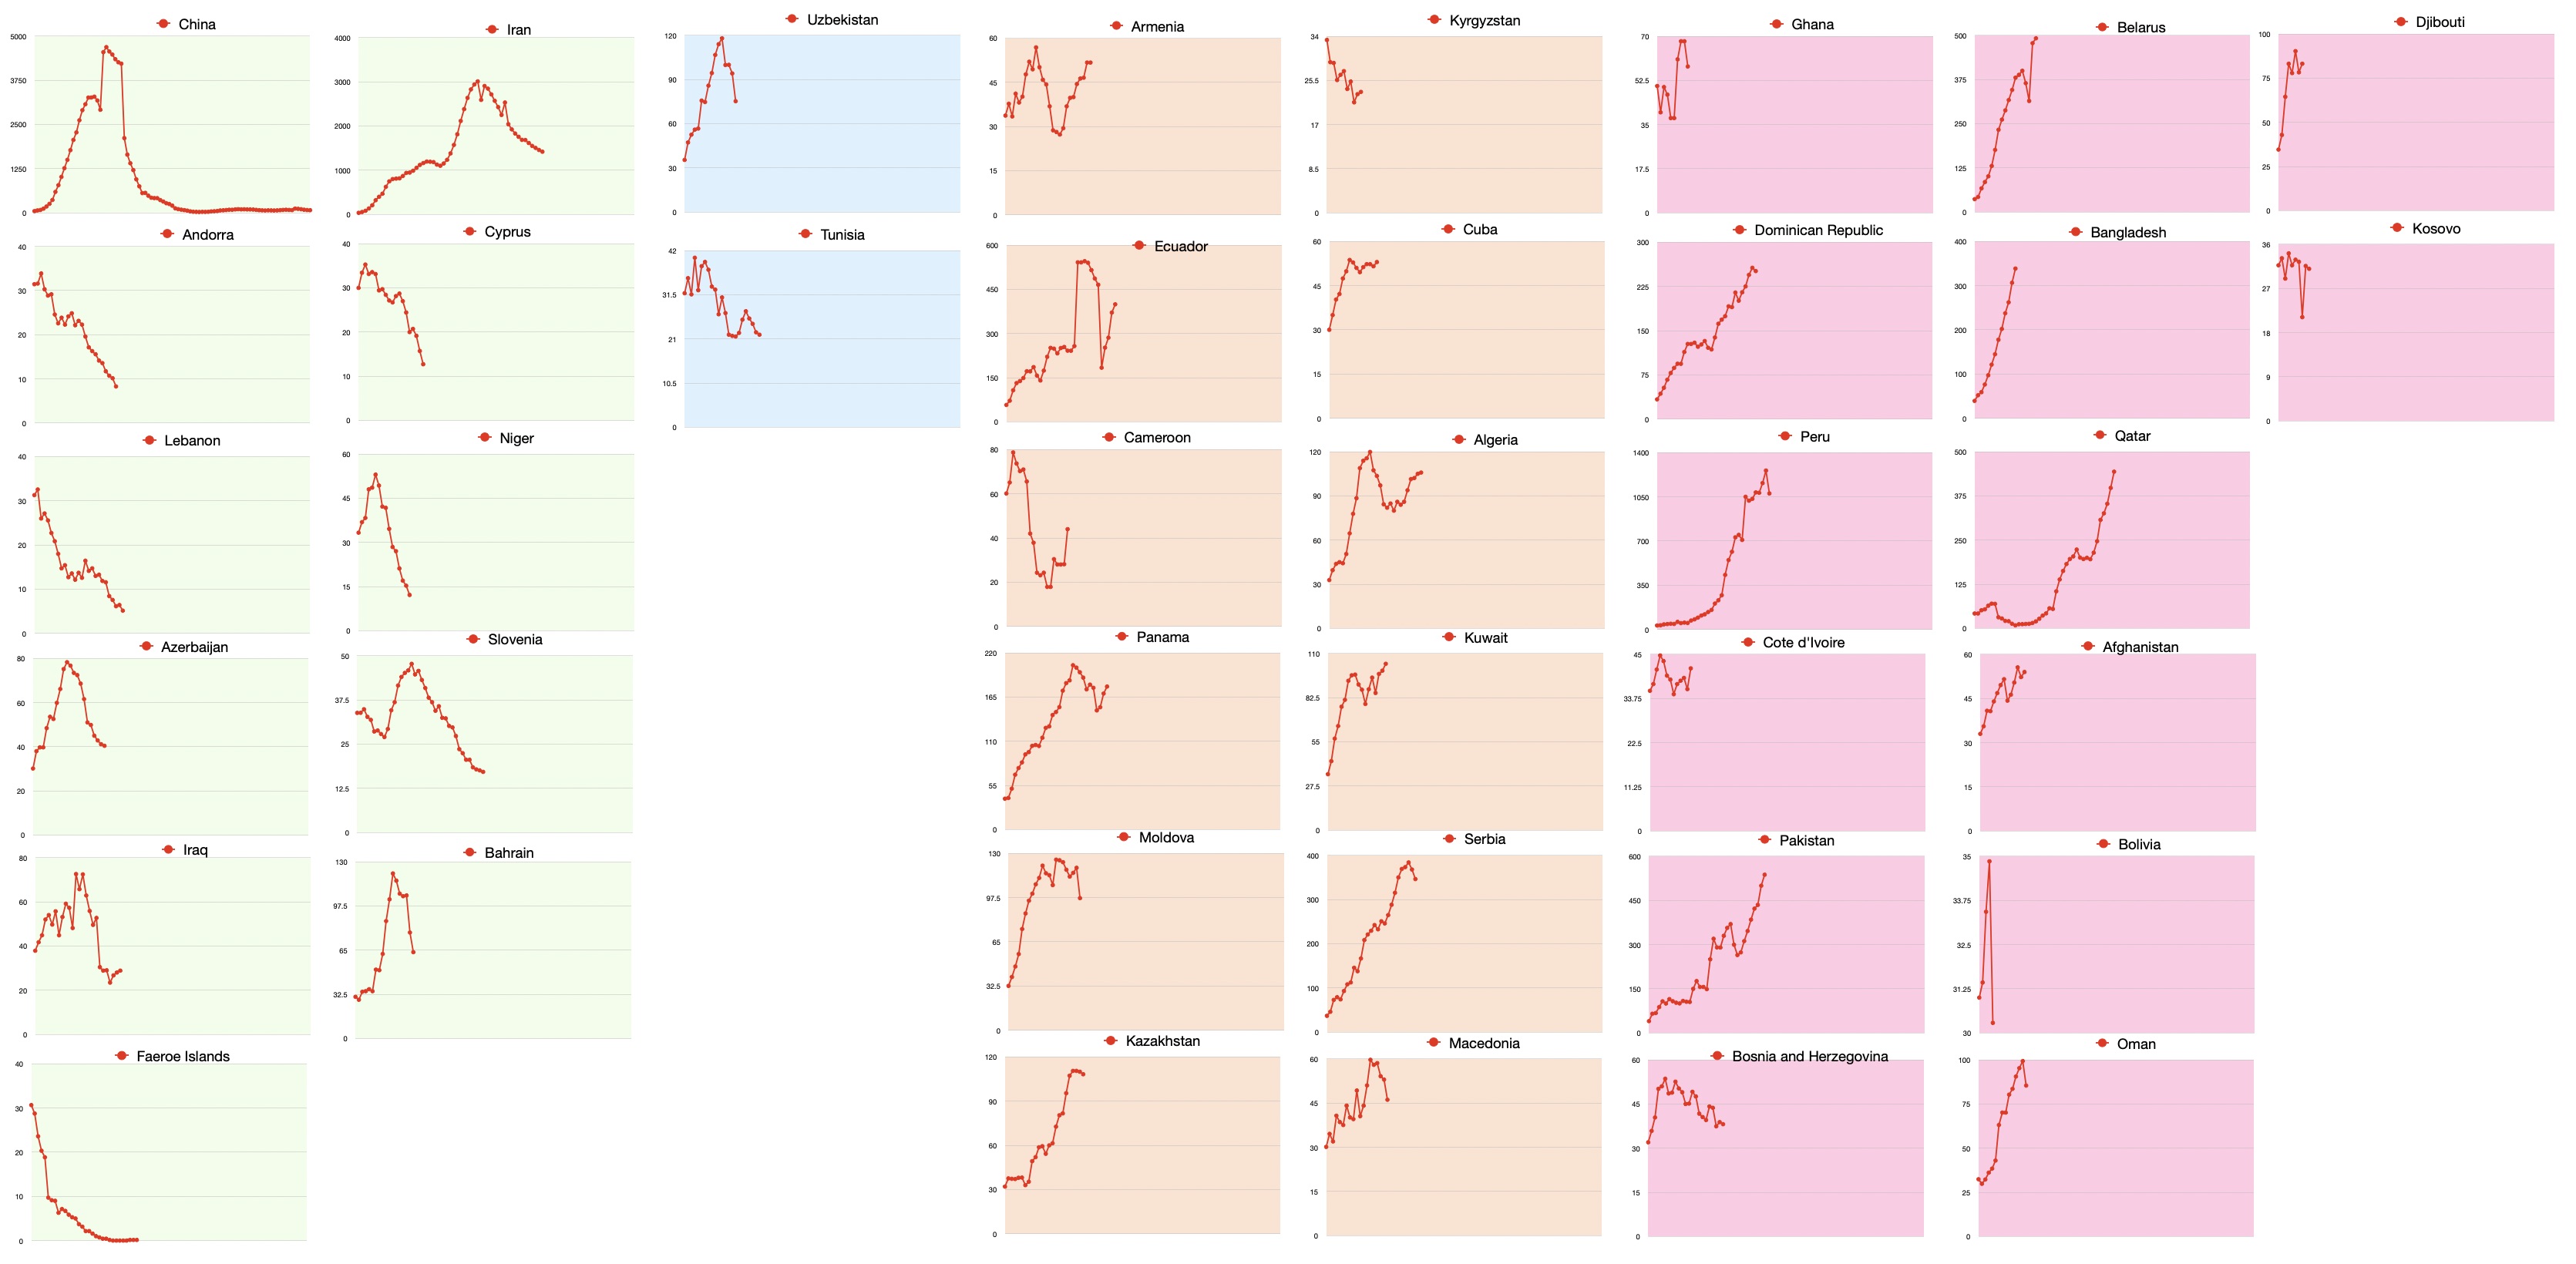
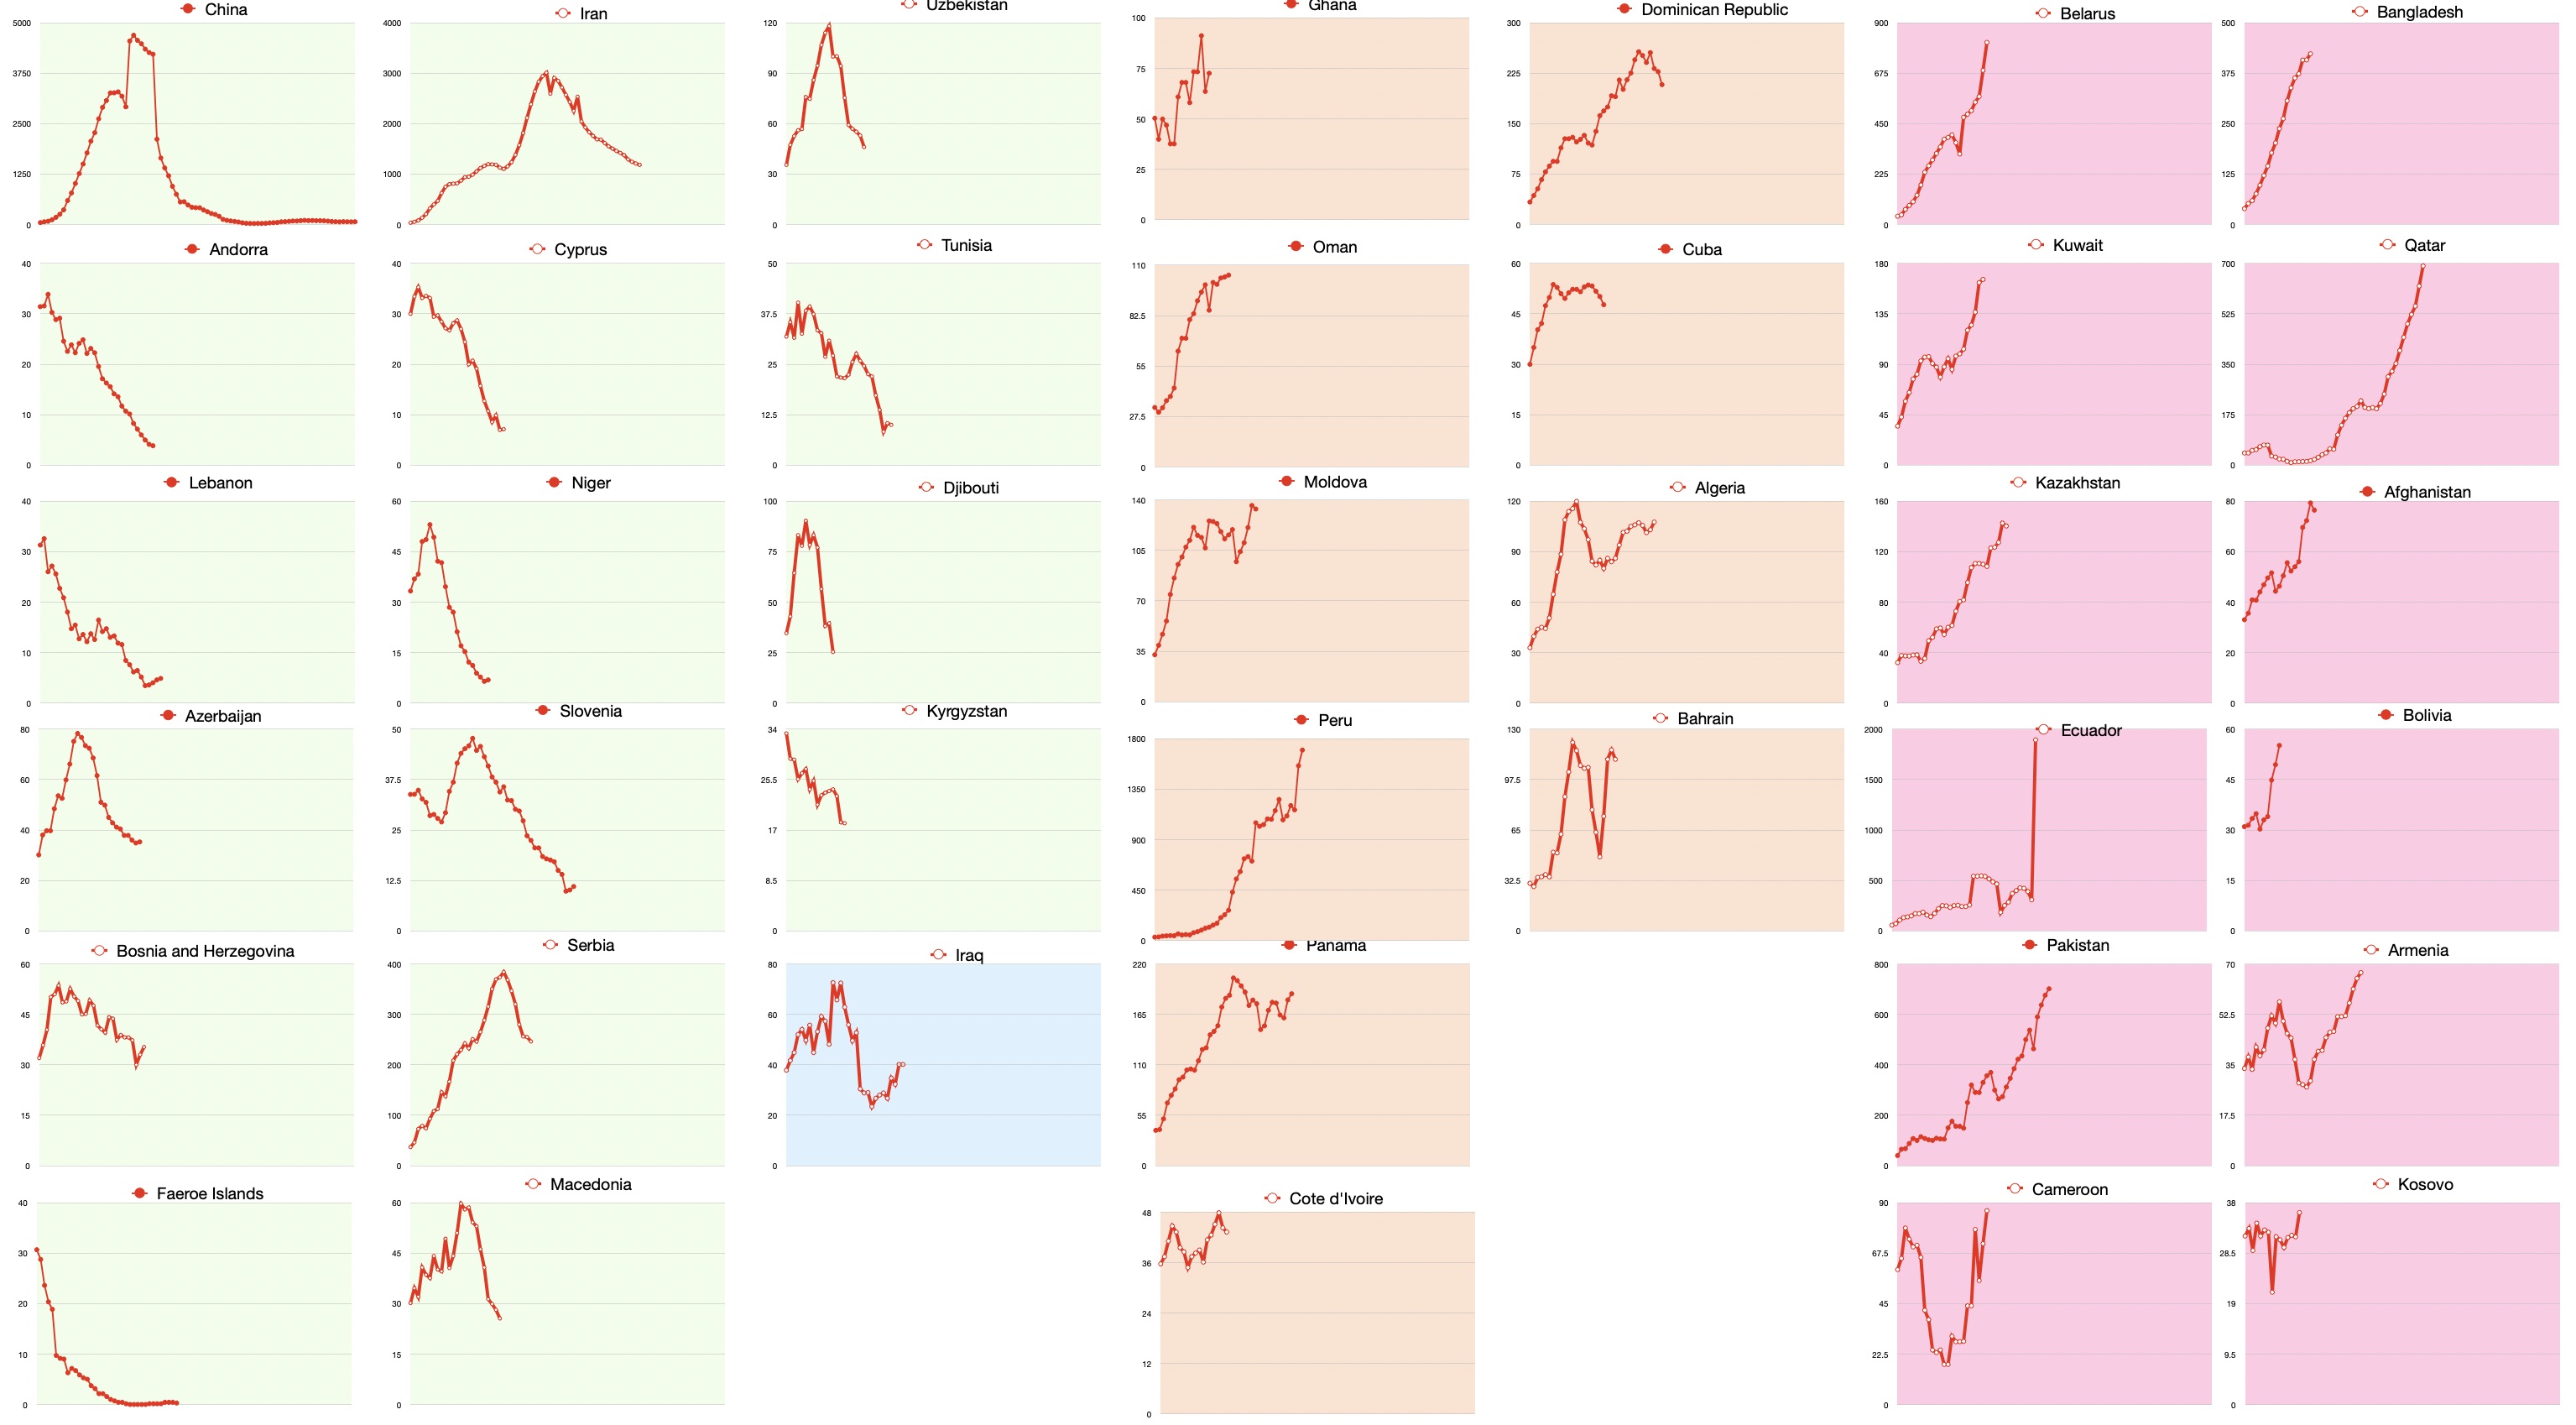
The Covid-19 case rate for 94 selected countries and the EU. Apple Mobility Trend for 55 countries.
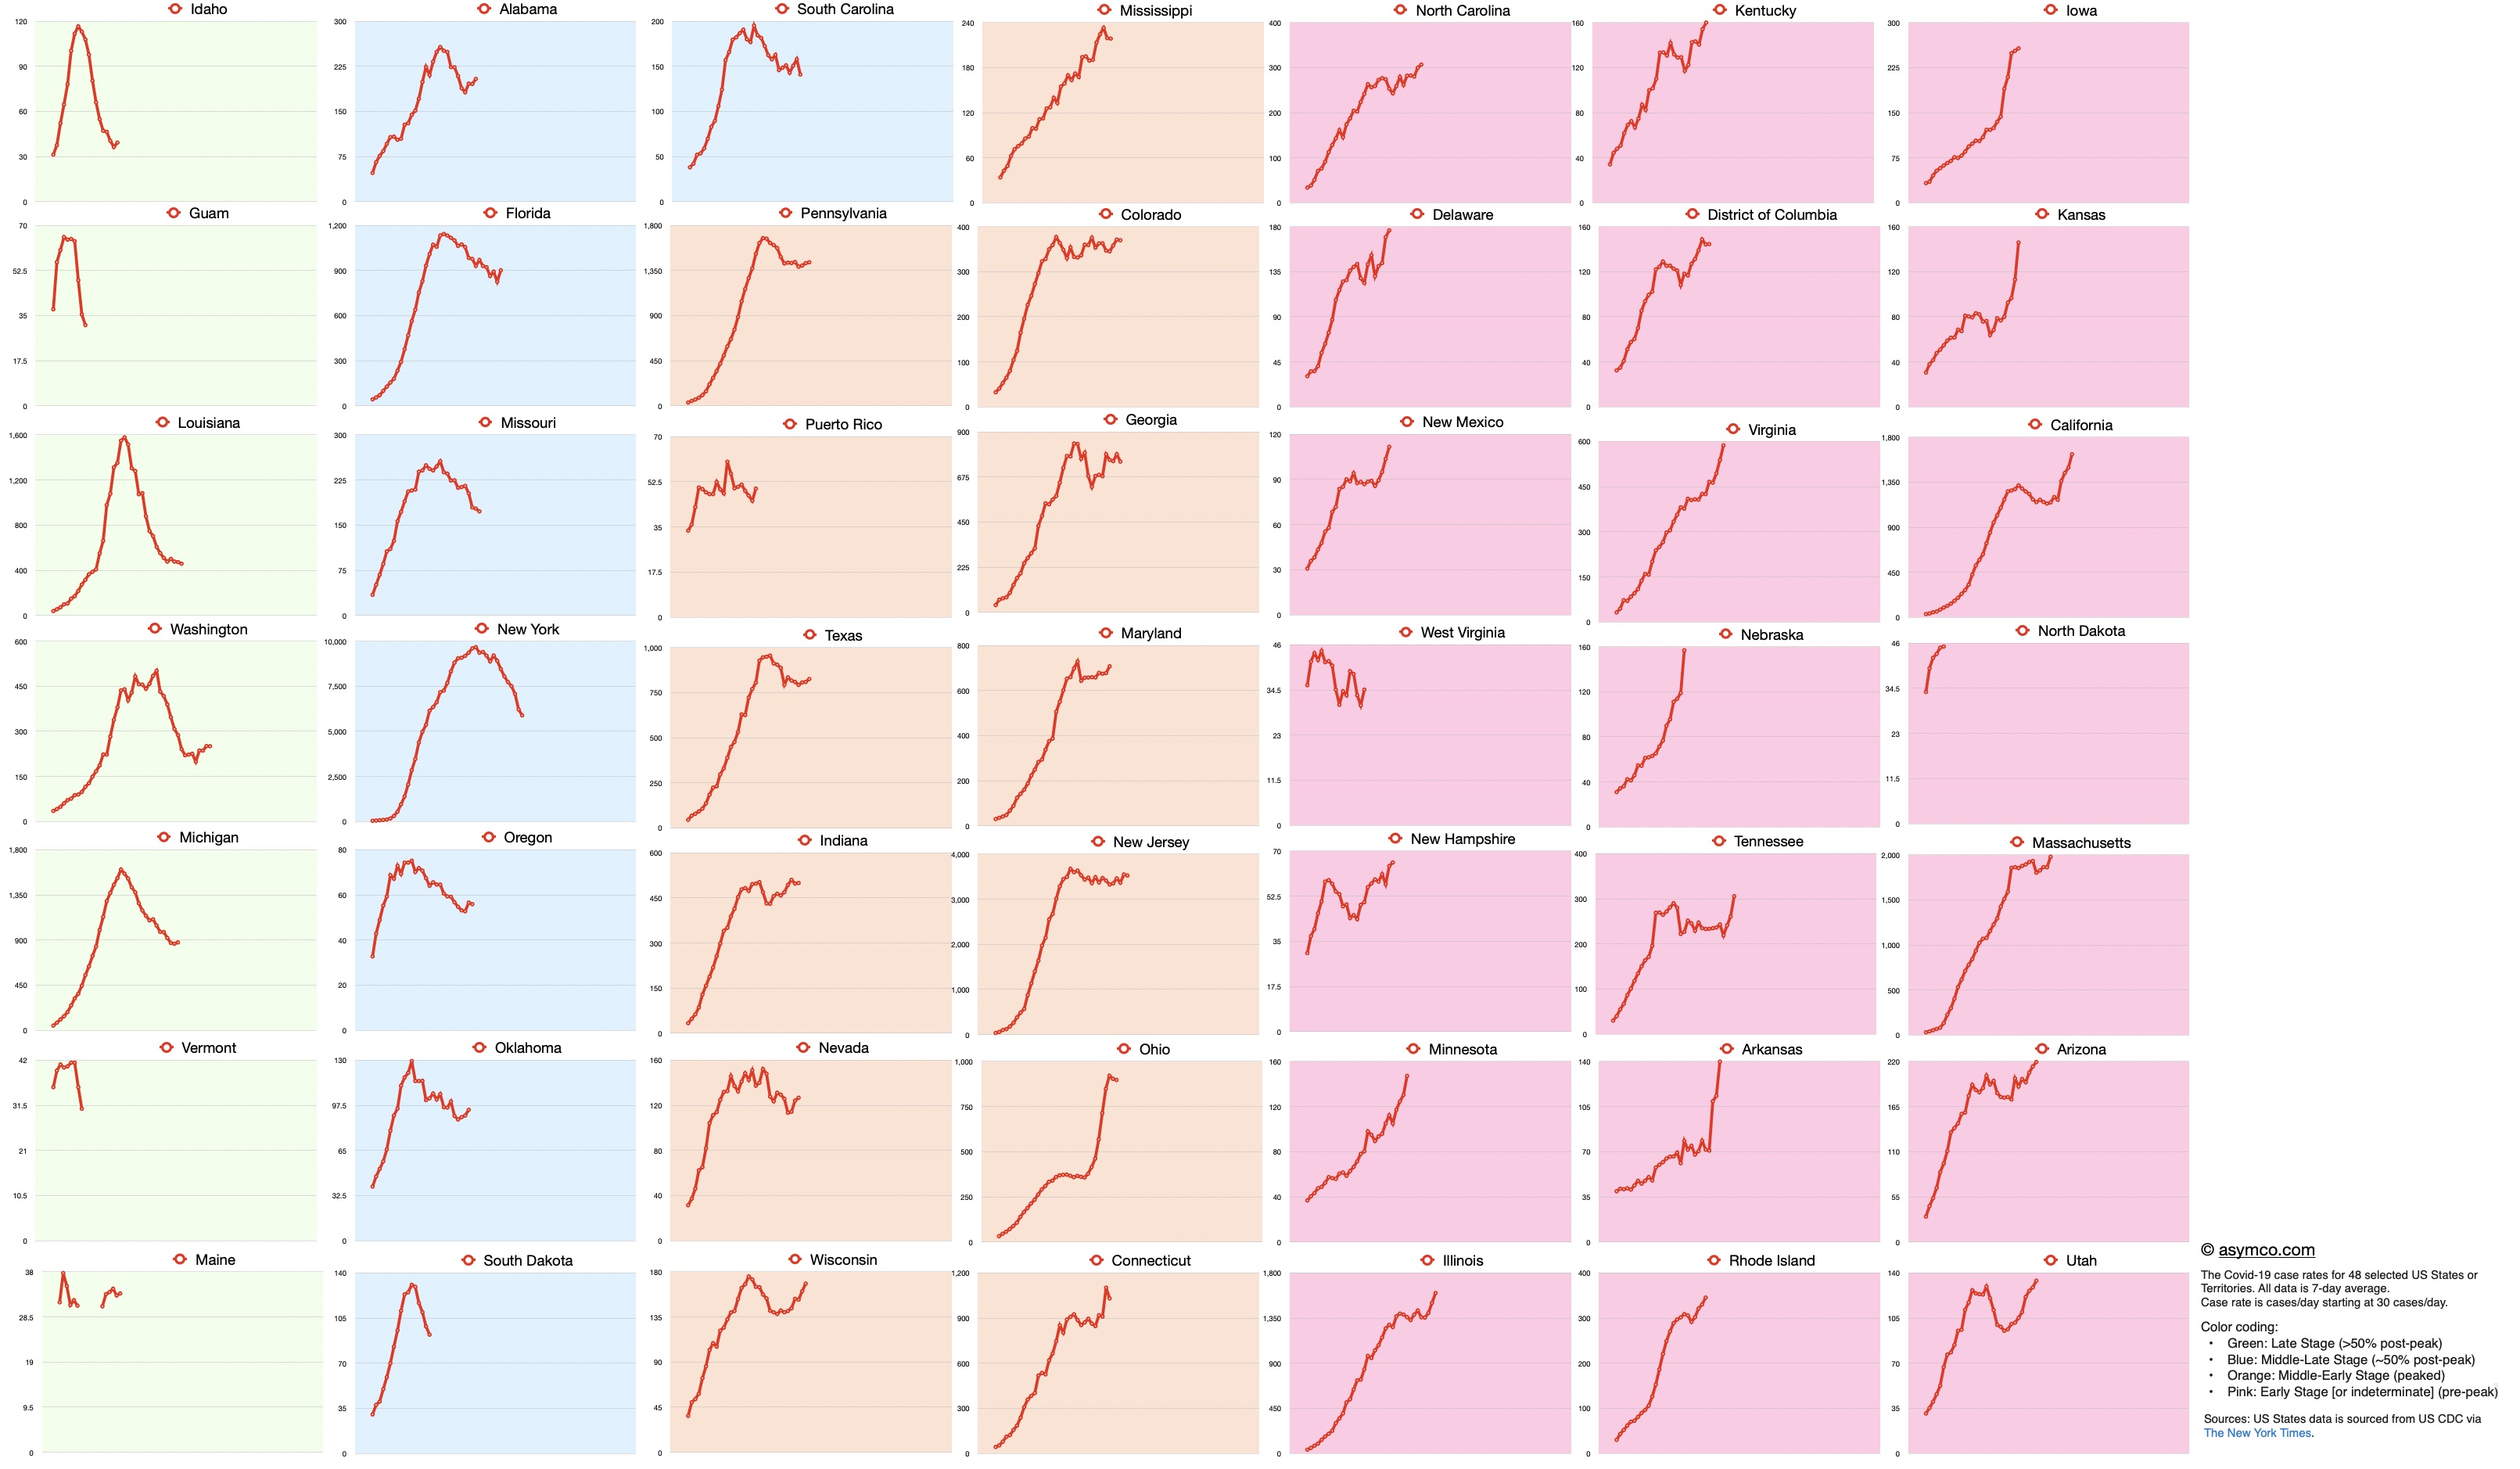
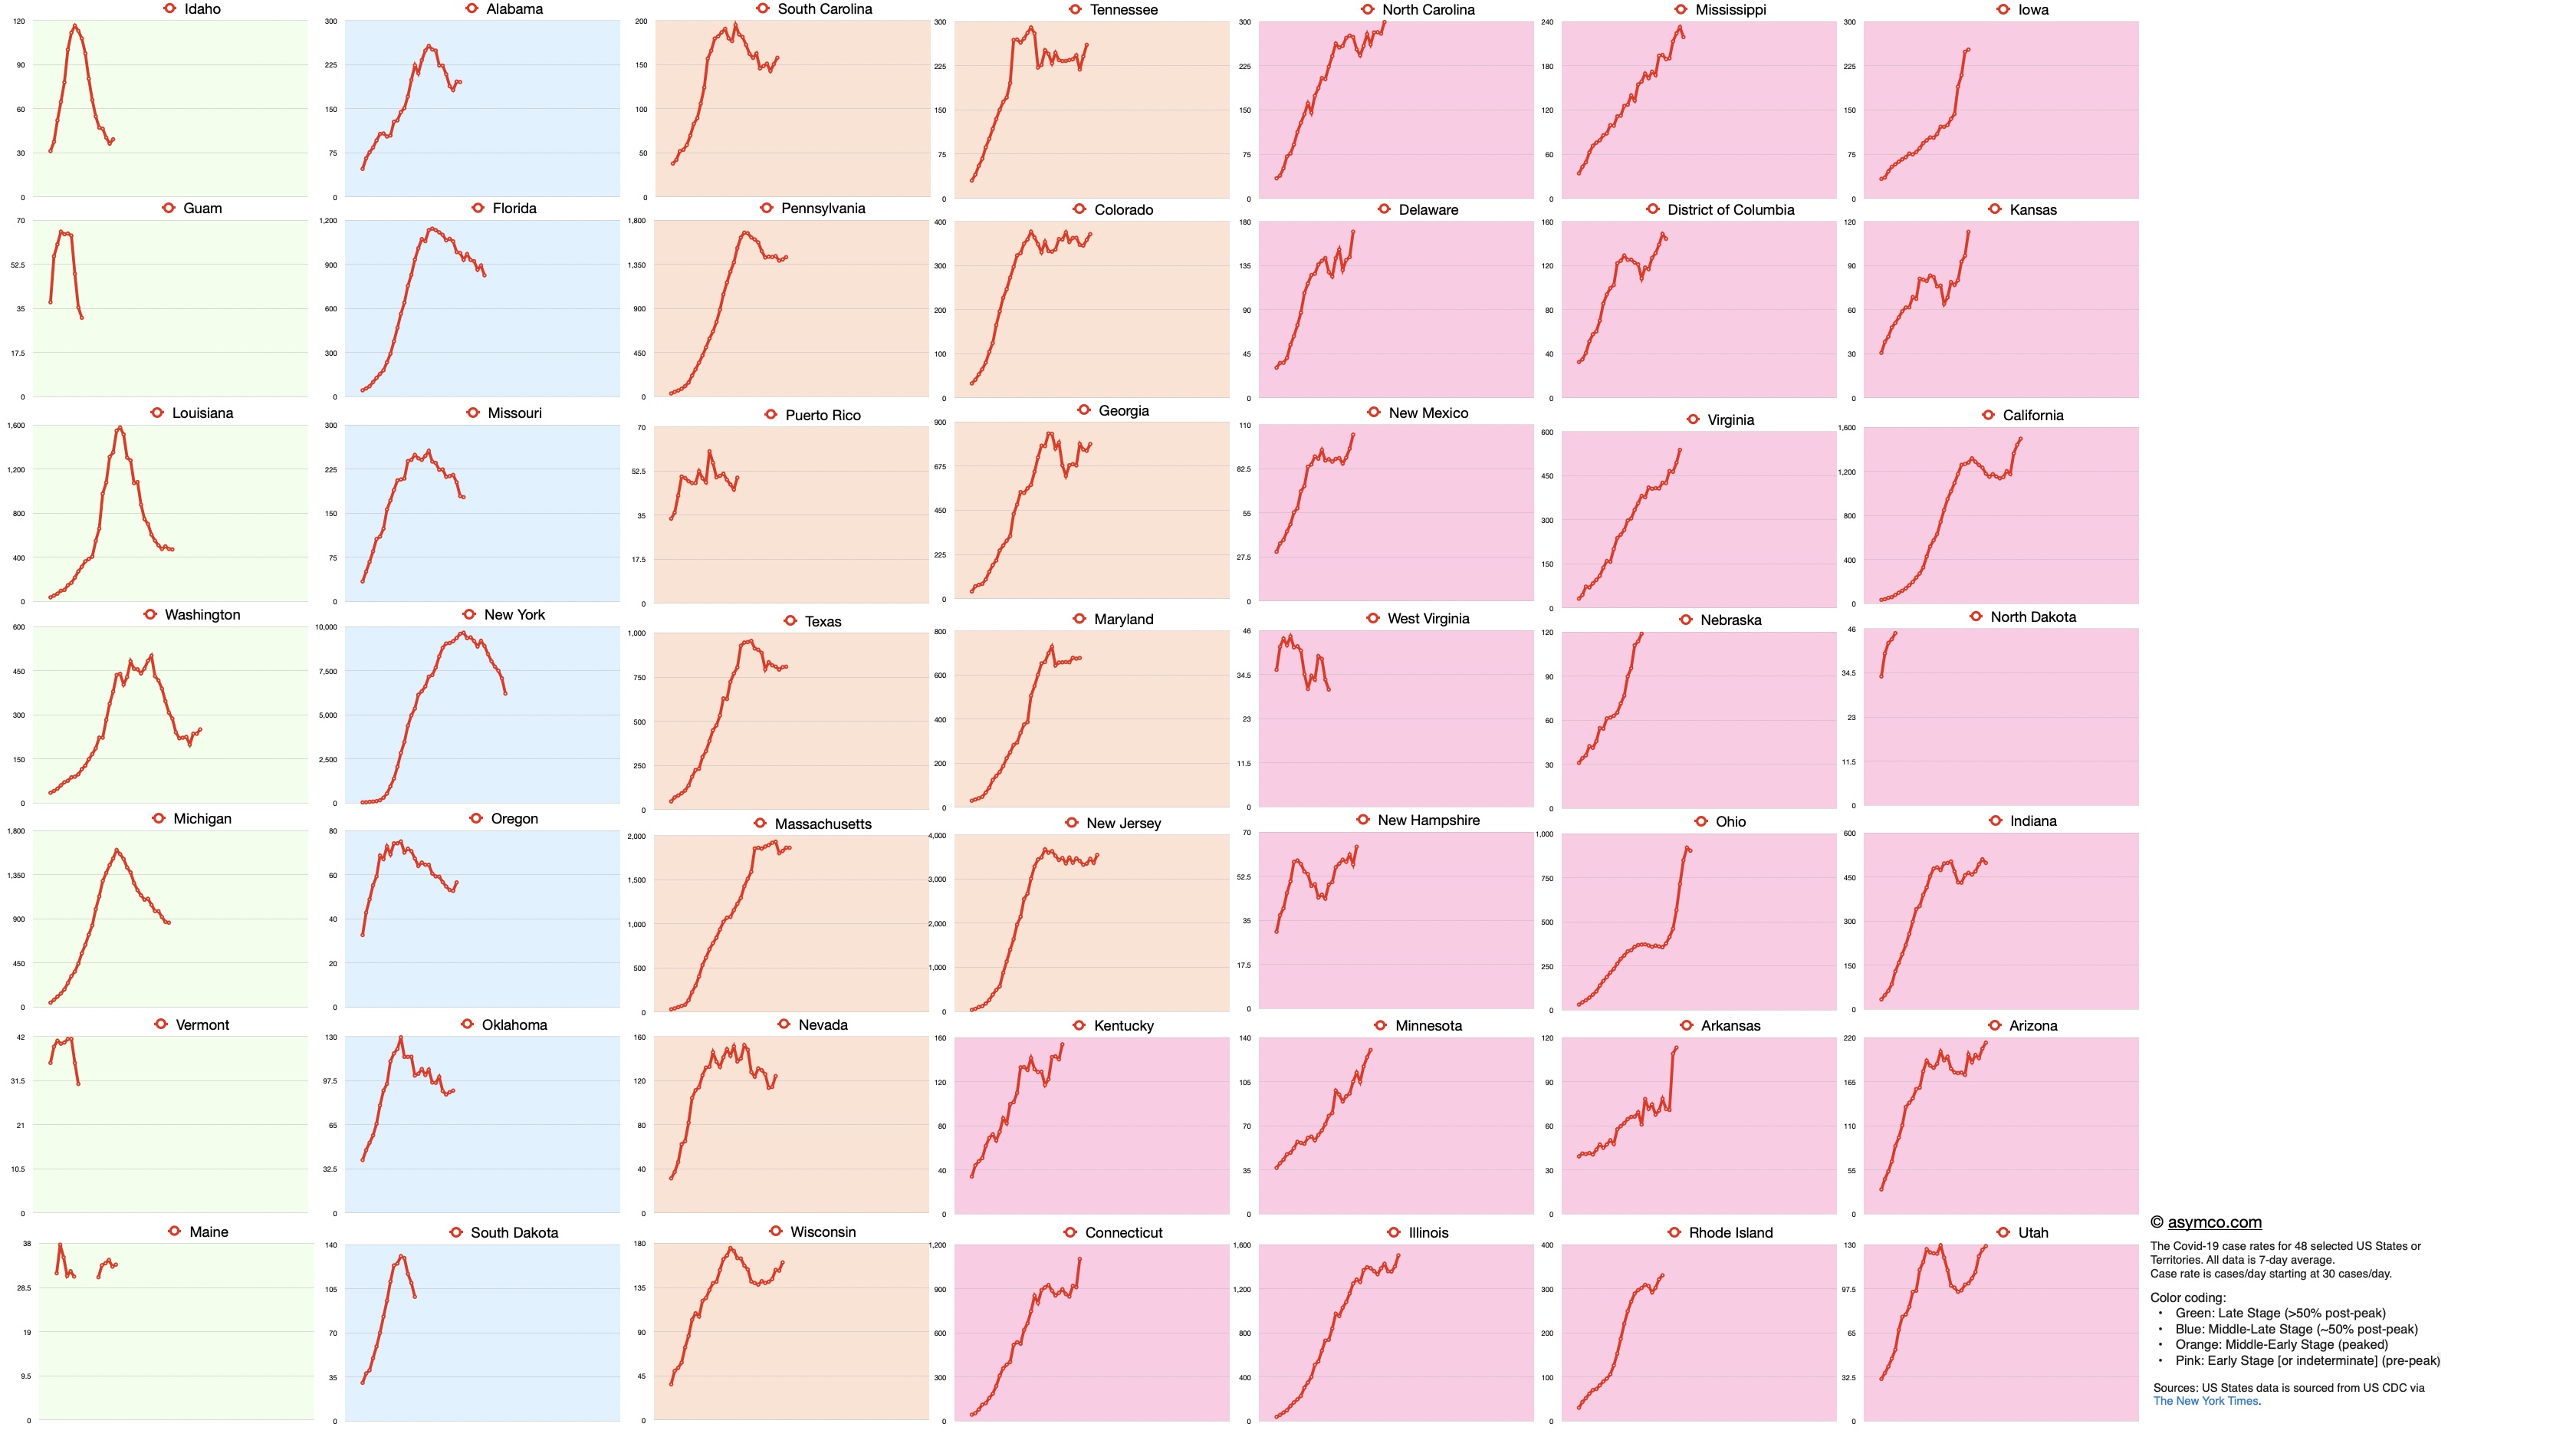
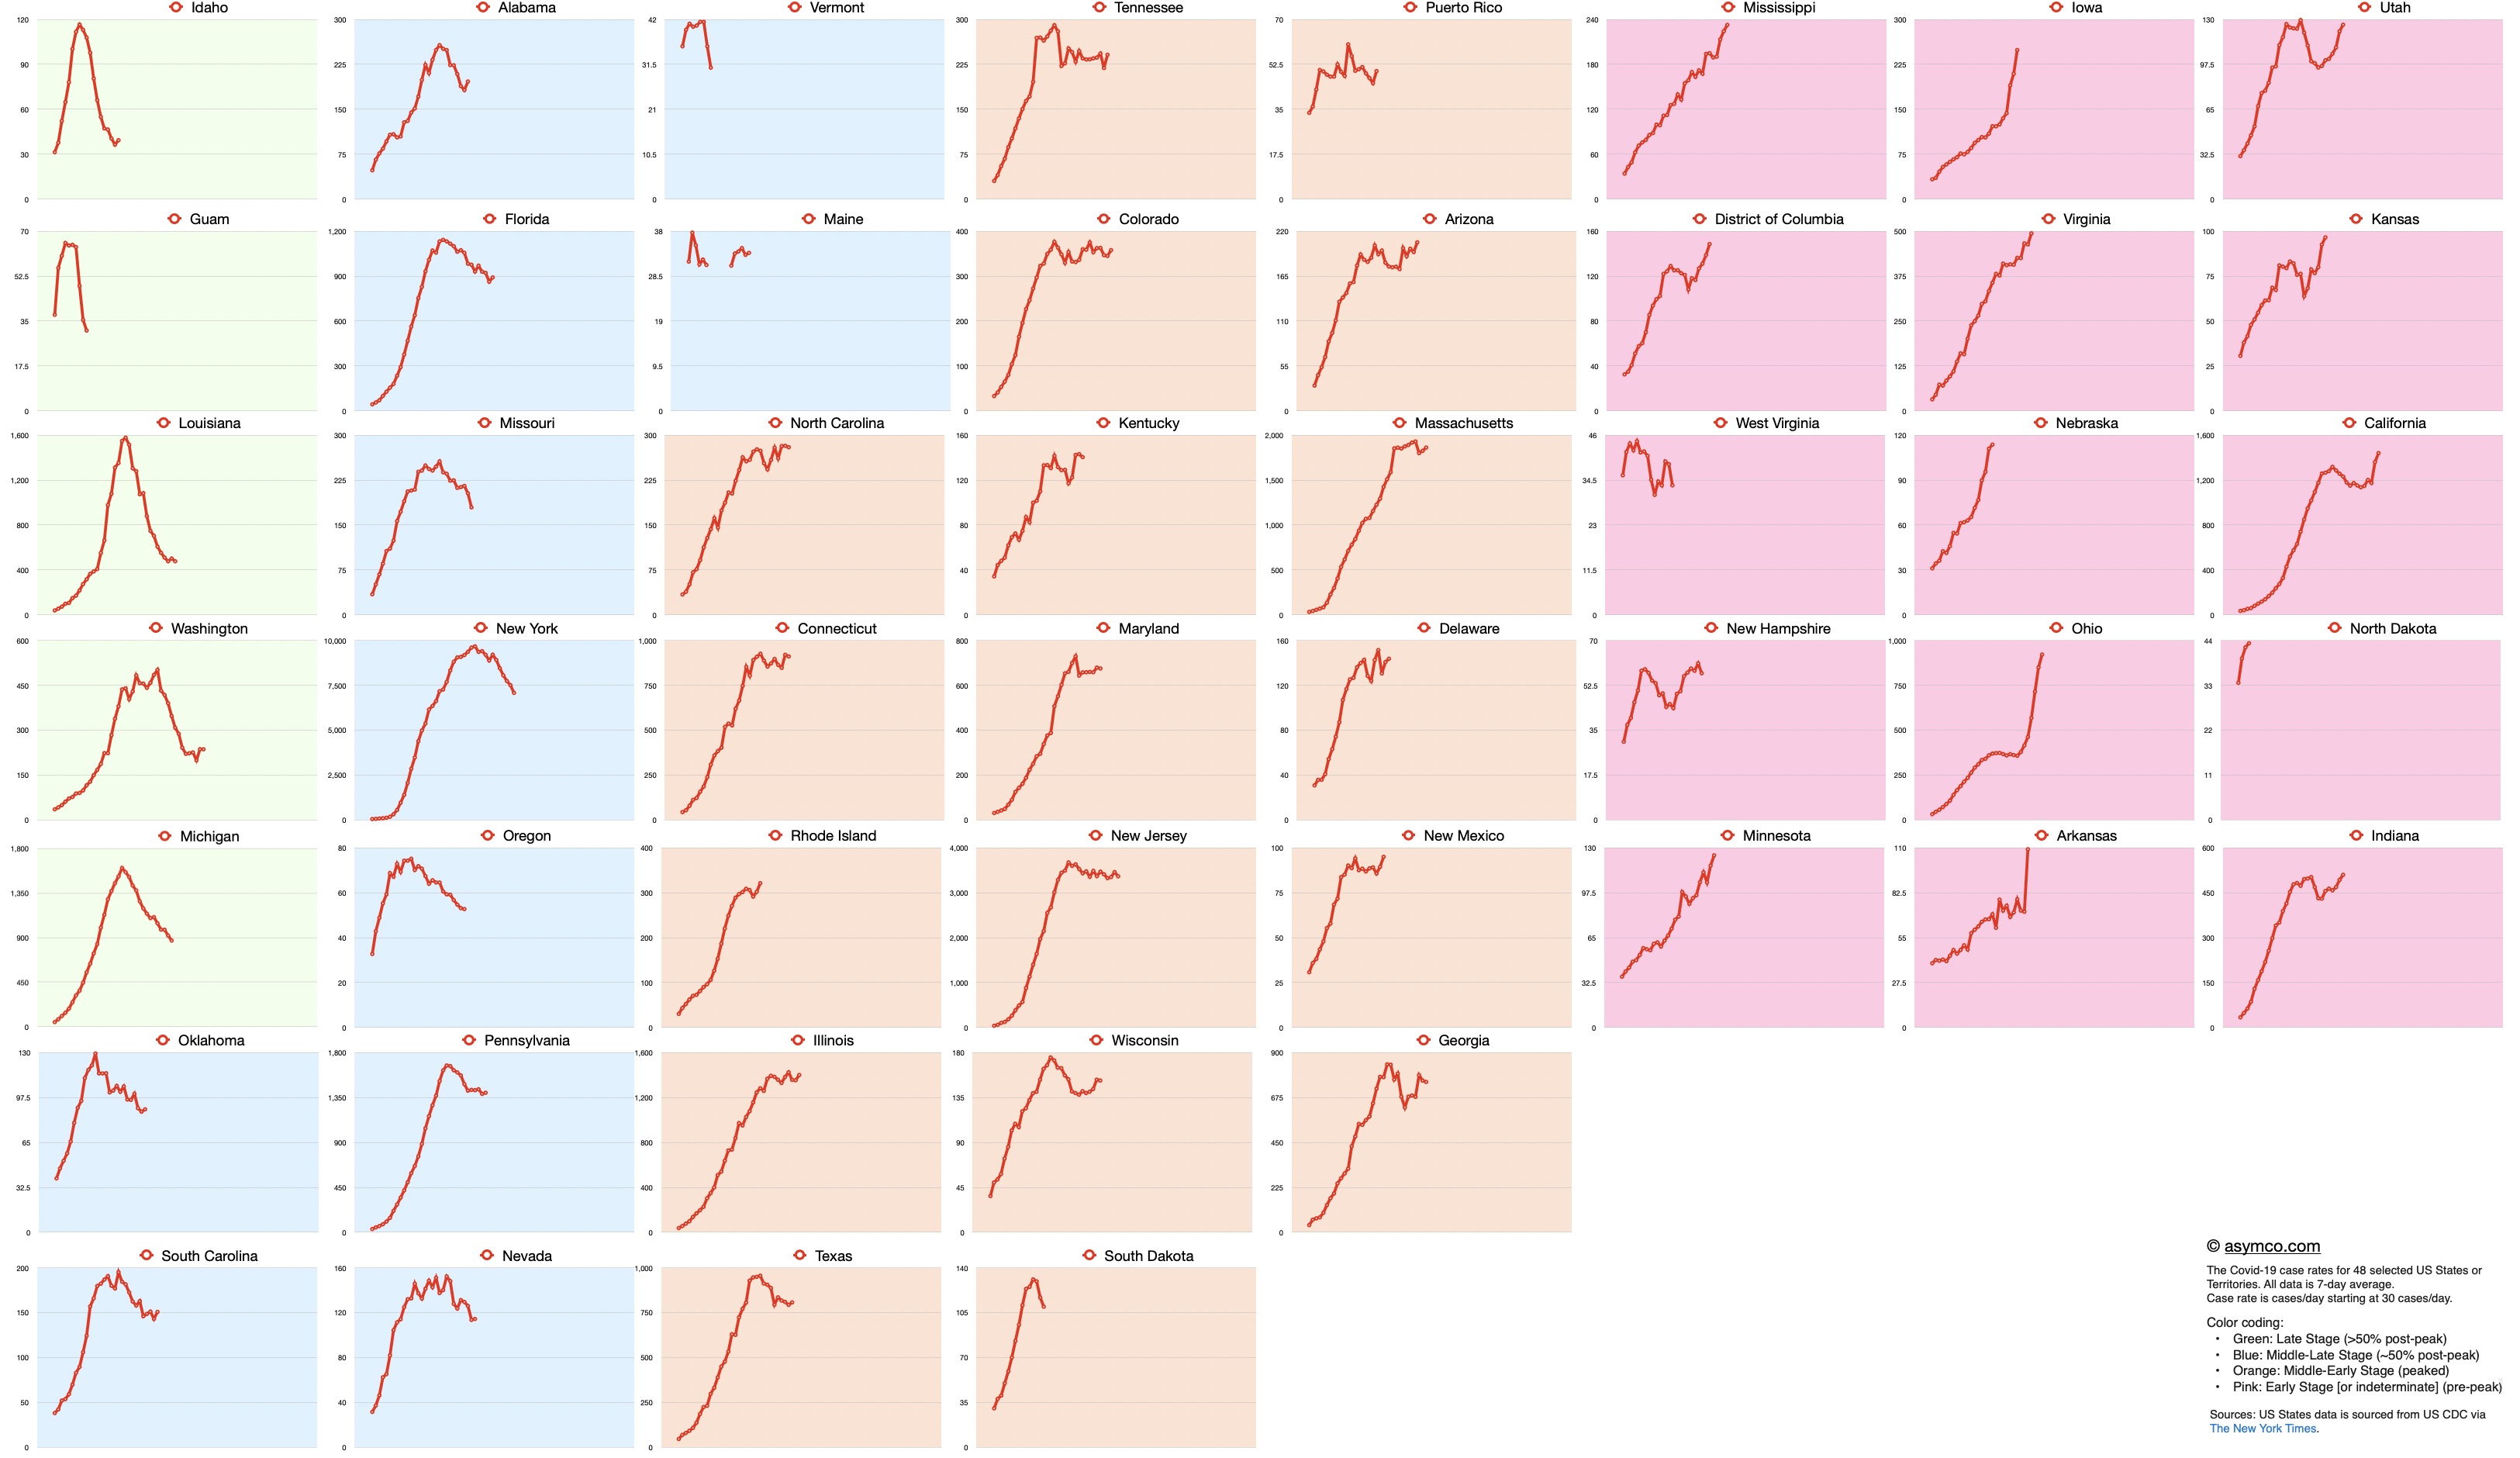
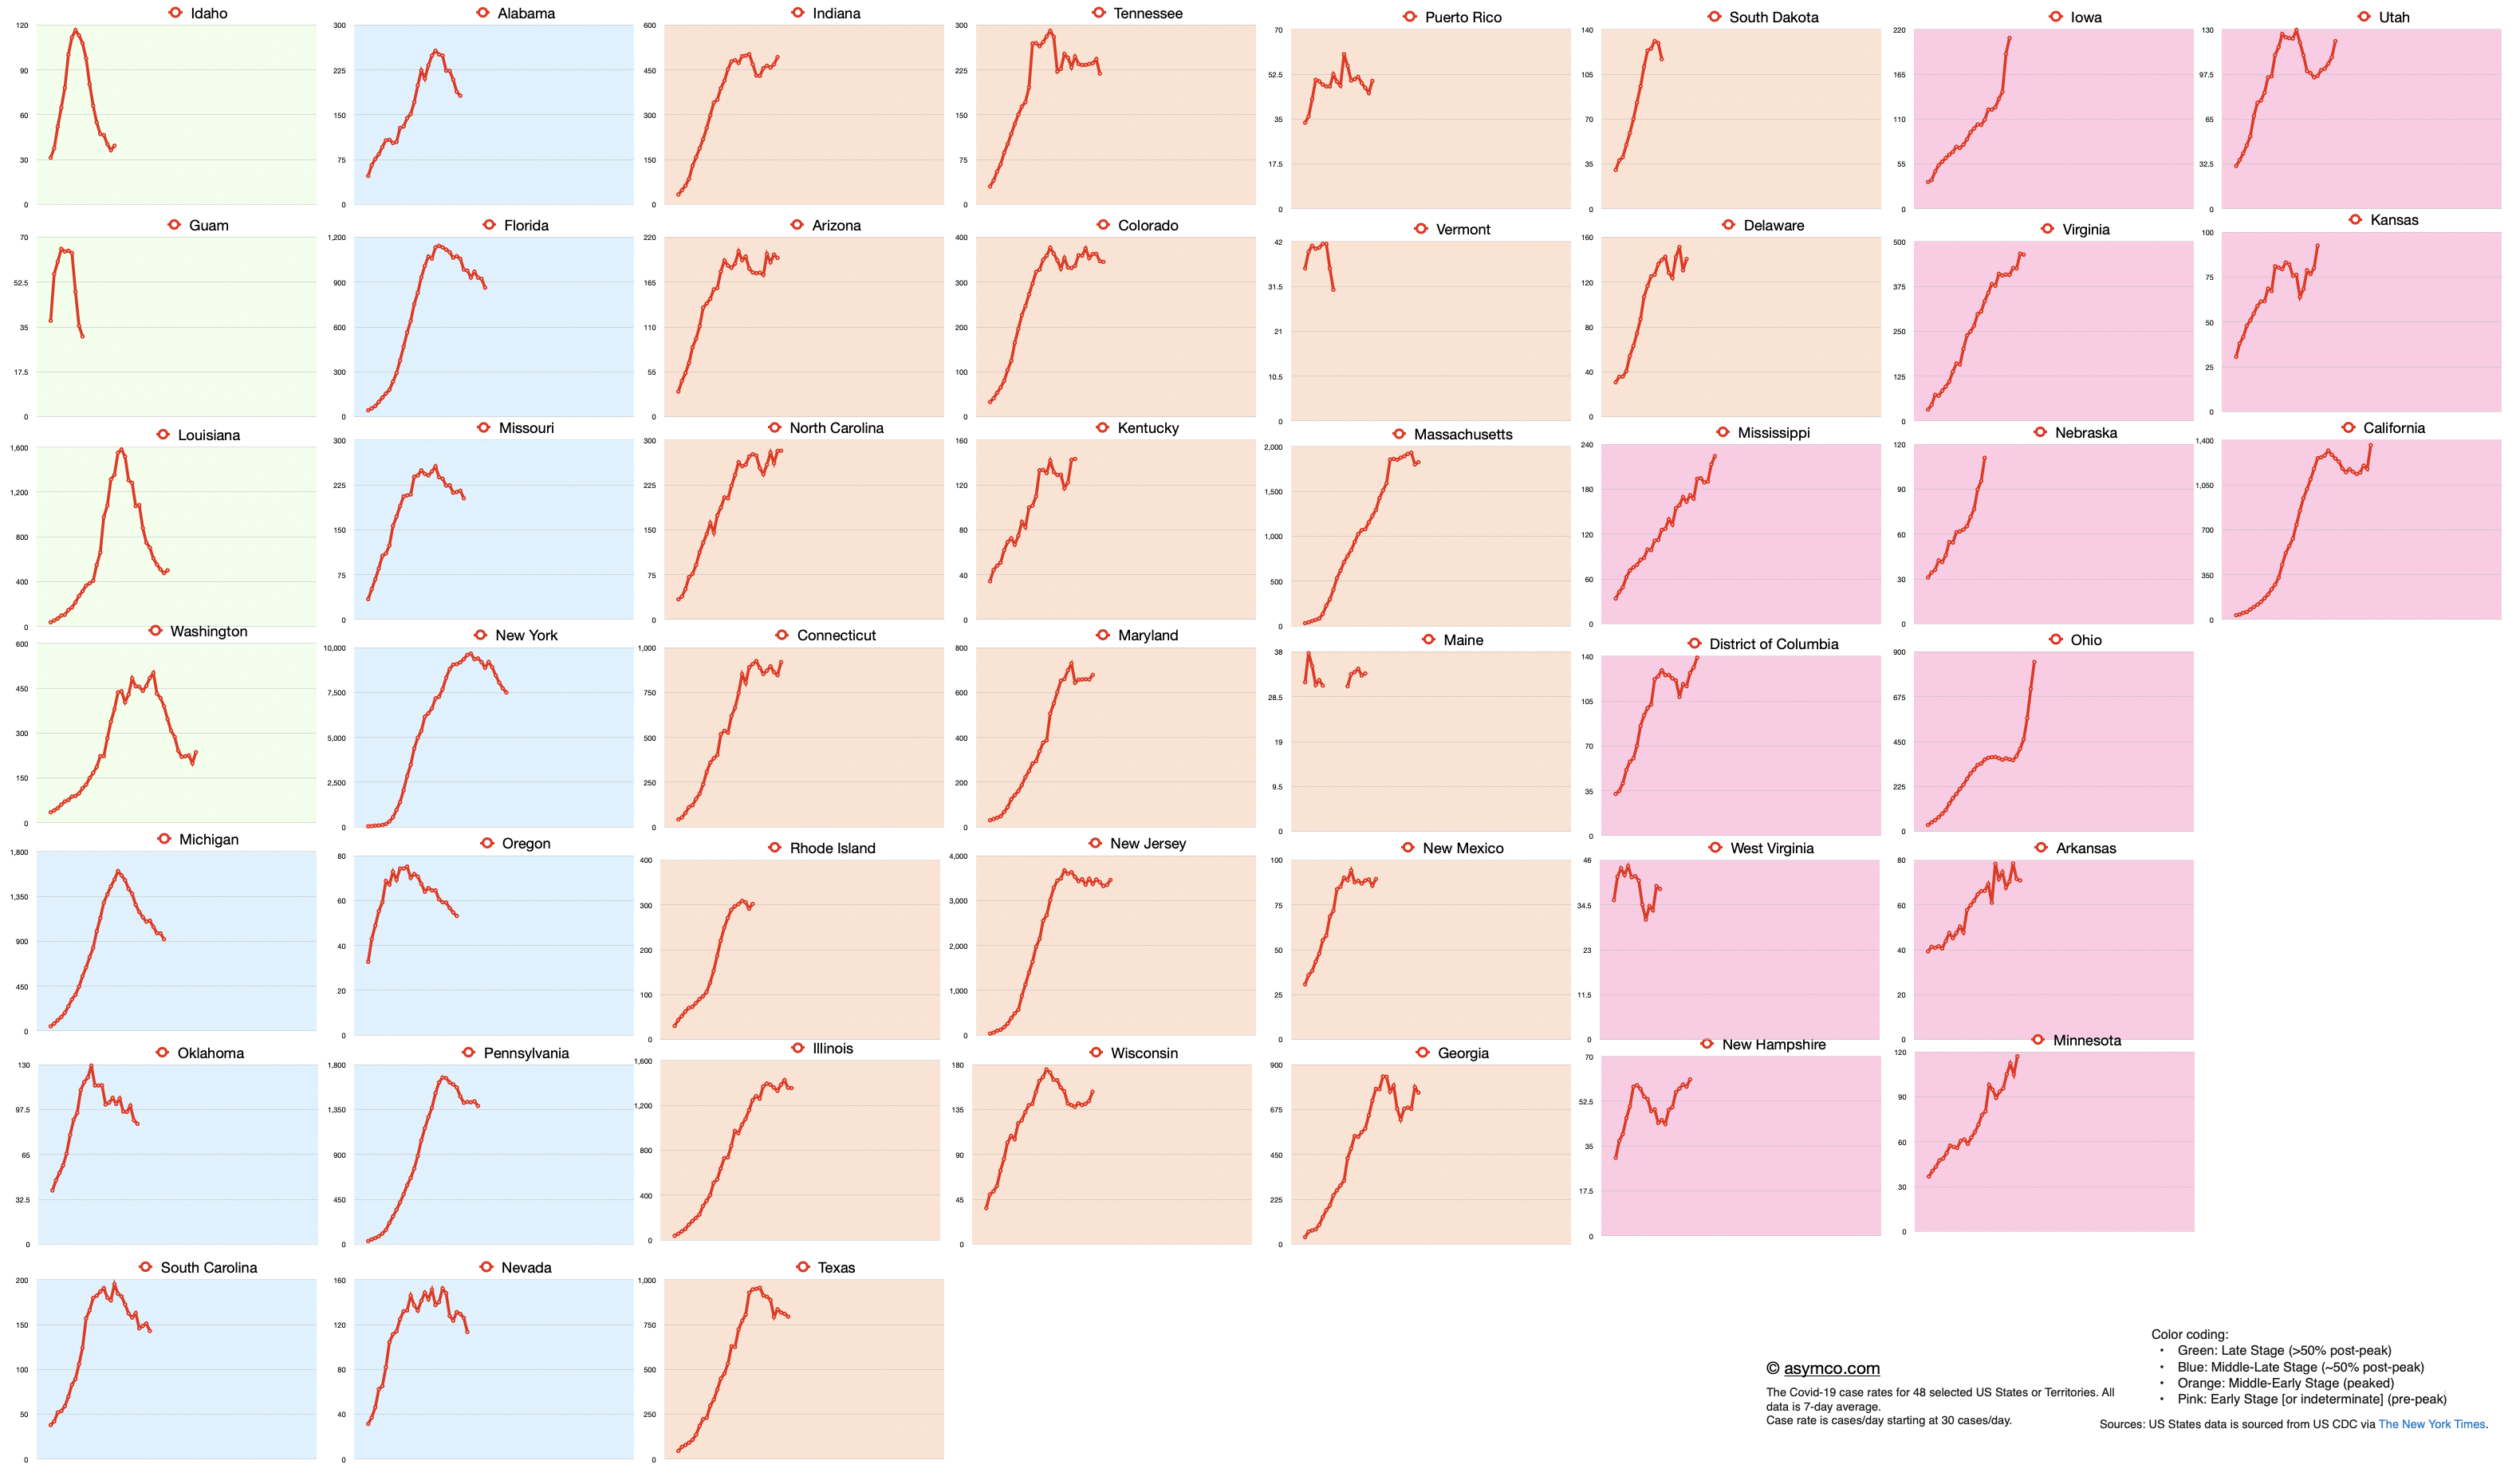
Background color coding:
- Green: Late Stage (>50% post-peak)
- Blue: Middle-Late Stage (~50% post-peak)
- Orange: Middle-Early Stage (peaked)
- Pink: Early Stage [or indeterminate] (pre-peak)
19% of countries are currently Pink.
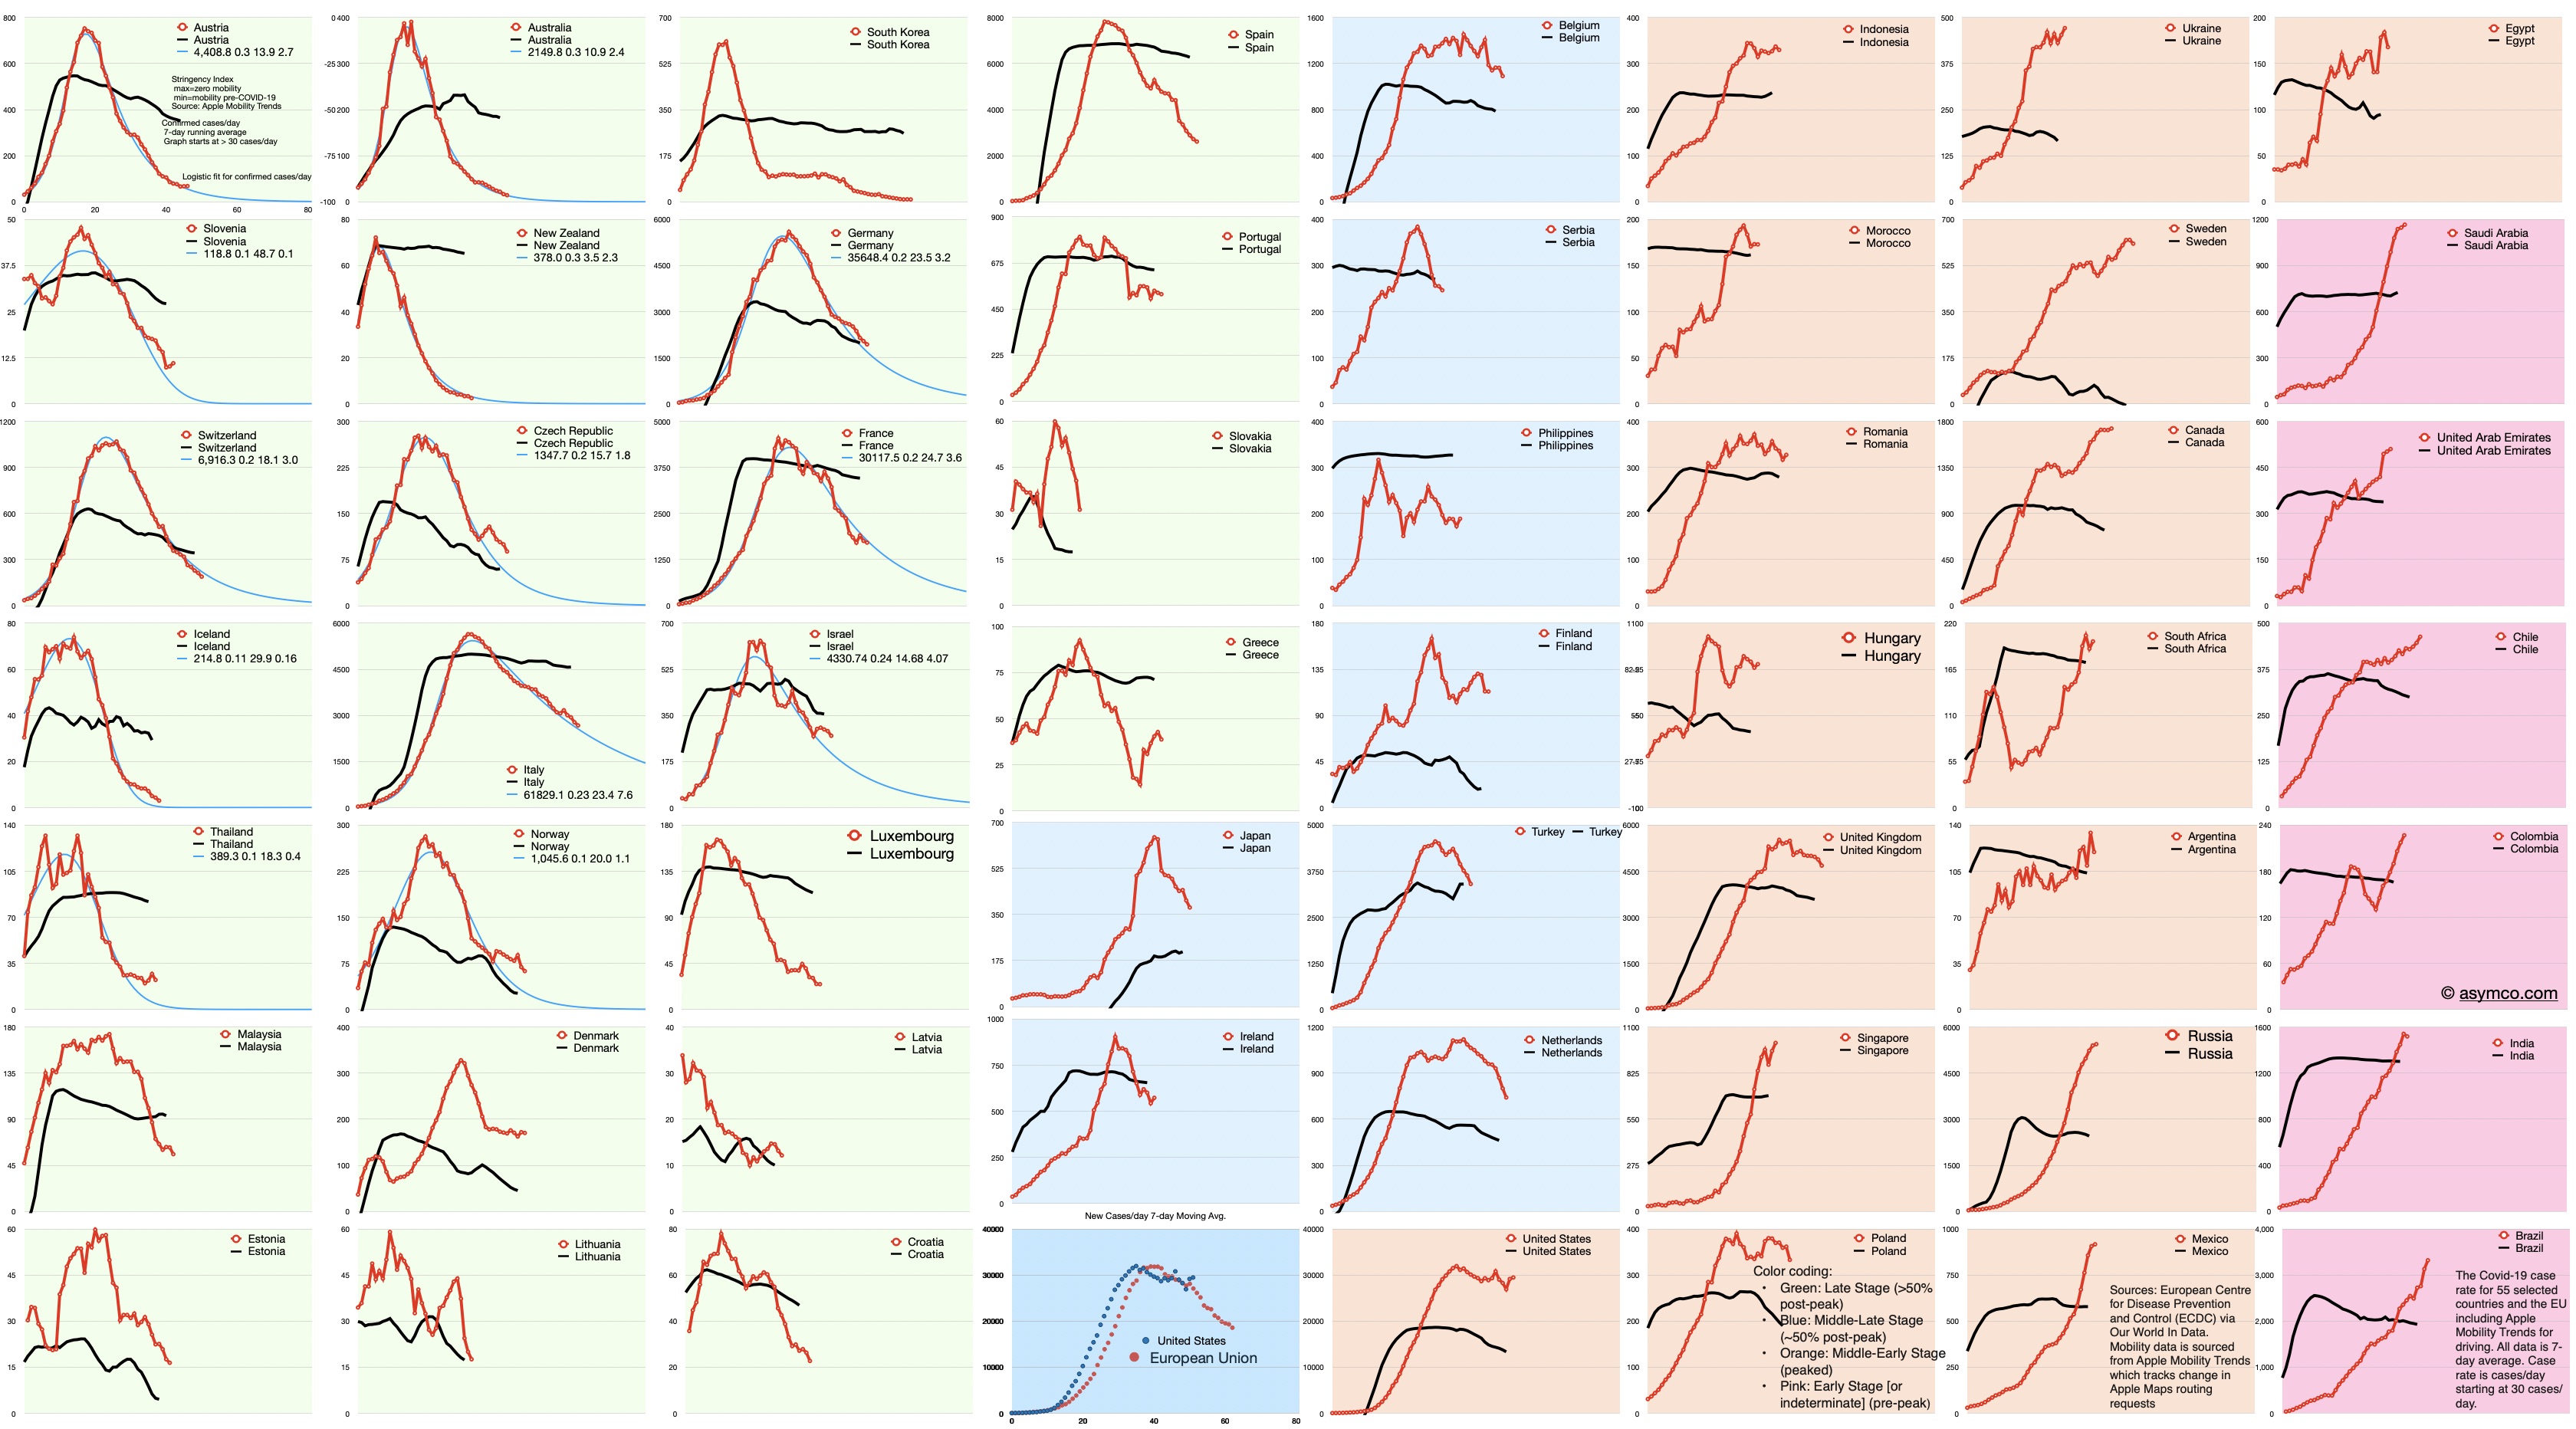
Black line is Stringency Index which is inverse of Apple Mobility Trends (lower bound means no change in mobility, upper bound is zero mobility).
All points are 7-day averages.
Click on images for higher resolution or download.
Sources: Cases data from European Centre for Disease Prevention and Control (ECDC) via Our World In Data. Mobility data is sourced from Apple Mobility Trends which tracks change in Apple Maps routing requests.