For more analysis of Apple & the industry, join us at ACTIVE 2025.

Right on Cue

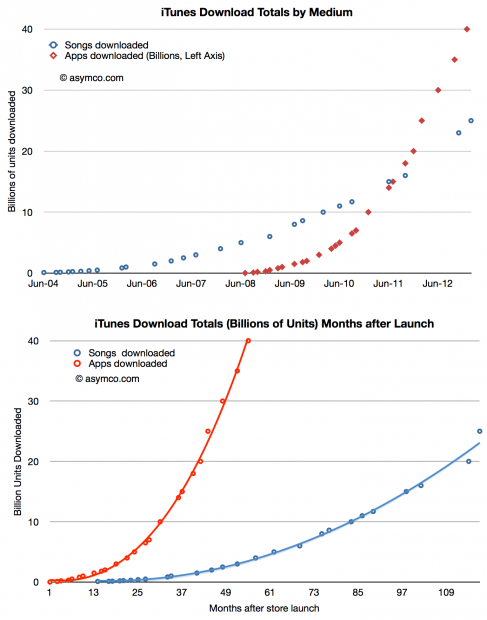
On February 6th, 2013 Apple reported that a total of 25 billion songs had been downloaded from its iTunes music store. The previous definitive value was in October 2011 though there was mention of “more than 20 billion” in November. App download totals have recently been much more frequently updated as the following chart shows:

Screen Shot 2013-02-12 at 2-12-2.17.06 PM

[I estimated 21 billion for the November total.]

The latest two data points point to a surge in iTunes song download rates. Prior to last fall the download rate seemed to be hovering around 10 million songs per day. Continue reading “Right on Cue”

The race to a billion—2012 Update

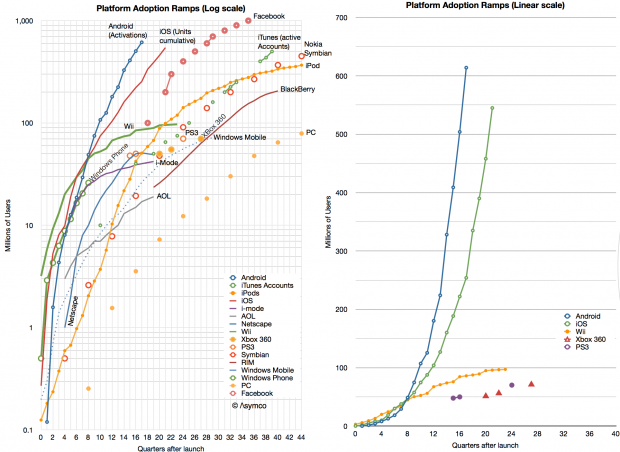
I last looked at the race to a billion in March 2011. Since then, I’ve been updating and adding data to the set giving a broader selection of platforms to compare.

Before we dive in, an explanation: the initial review excluded Windows (PC) and Facebook mainly because (a)  the ramp scale I’m using is about a decade in duration and (b) I was reluctant to compare platforms that require payment to join to those that don’t. The (DOS/Windows) PC ramped over several decades (starting in 1981) and Facebook is a service that costs nothing to join. There was much gnashing of teeth and shaking of fists as a result.

Therefore, in the interest of inclusion, I added both to the data set and let the chips fall where they may.

The data is shown below.

Screen Shot 2013-01-16 at 1-16-2.11.50 PM

I kept the scale to about a decade so that individual lines can be resolved. As a result, you’ll note that although Windows reached one billion first it did so slowly enough to be off the scale shown. Indeed, the “race to a billion” should be titled  “The race to one billion users in less than a decade”.

In such a competition, the winner would be Facebook which, in October 2012, 35 quarters after launch, reached the finish line. The second looks to be Android (probably this year) and the third iOS (sometime next year.)

That may sound like the end of it, but what the graph also shows are the more subtle trends: Continue reading “The race to a billion—2012 Update”

The uncanny similarity between EU and US smartphone markets

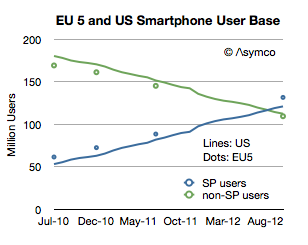
comScore released one of its rare updates to the EU5 (Spain, UK, France, Italy and Germany) smartphone market. Note that the data is claiming to show installed base and not sales in any particular period. What interests me is a comparison or contrast between the European market and the US market.

First, total users.

Screen Shot 2012-12-19 at 12-19-7.30.57 PM

The EU has about 500 million inhabitants while Europe overall has 731 million. The EU 5 total about 314 million which is very nearly the same as the US (311.6 million). Therefore the EU5 is a good comparable to the US in terms of population. As the graph above shows it’s also remarkably similar in its adoption of smartphones. Note that the scale reflects users and since the populations are very similar then the penetration should also be similar.


The mystery of Samsung Electronics SG&A

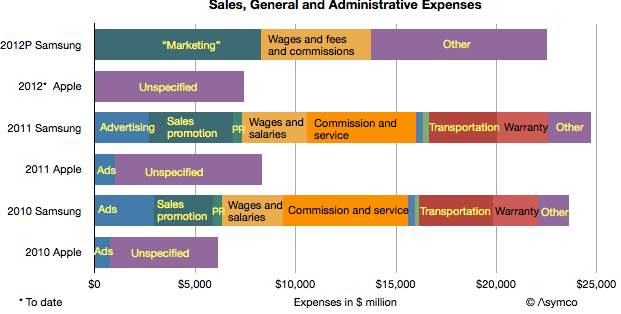
Samsung Electronics’ SG&A expenses are curiously high. Consider the following graph:

It shows SG&A as reported by Samsung and Apple over the periods 2010, 2011 and the sum of the first three calendar quarters of 2012. Note that Samsung appears to be spending three times as much as Apple on sales and administration.

The company offers a break-down of these SG&A costs and they are also shown (Apple does not provide a break-down except for advertising in its yearly report). The suspicion that something is not right comes from looking not only at the overall picture but the notion that Transportation, Warranty and “Other” for Samsung are higher than overall SG&A for Apple. Continue reading “The mystery of Samsung Electronics SG&A”

On Capital Spending's Transformation of the Electronics Industry – YouTube

Asymco’s Horace Dediu on Capital Spending’s Transformation of the Electronics Industry – YouTube.


A video of Horace Dediu’s presentation at IBM’s Electronics Global Leadership Forum in Taipei on 23 October 2012. Horace discusses how Apple’s enormous capital spending is reshaping the global supply chain for the industry.

Apple's Growth Scorecard for third quarter 2012

In the parlance of developers Apple keeps “throwing exceptions.” This quarter the iPad surprised with a significant decline in sales growth. I placed a table showing the sales growth for this quarter as well as the previous 22 quarters at the bottom of this post.

Here is a quick review of each line:

  1. The iPhone returned to a more customary growth rate (which I rate as Very Good–above 50%). The quarter was bound to be quirky due to it being both a transition quarter and a launch quarter. The launch of the iPhone 5 came quite late but not too late to make a contribution. It was also widely rumored and anticipated so there was slowing of the previous generation product. I expect growth to accelerate further in the last quarter of the year.
  2. The Mac turned in a commendable 6% revenue growth (1% unit growth) on the back of the new 15″ Retina screen MacBook. The average sales price increased sequentially and the mix of portables to desktops reached a new high of above 80%. More about the Mac will be written in a future post. Continue reading “Apple's Growth Scorecard for third quarter 2012”

A limited number of The Critical Path The First Year print editions are available for purchase

The Critical Path, The First Year is now available on the Asymco Store.

  • Including DRM-free PDF and ePub downloadable files.
  • The print copies are signed.
  • Supplies are limited.

You can order  here: Asymco Store — The Critical Path Book.

Speaking at TOC Frankfurt October 9 about publishing

This is a quick note to mention that I’ll be speaking at the Tools of Change (TOC) Frankfurt Conference this October on the eve of the Frankfurt Book Fair. Conference details:

  • Tuesday, 9 Oct. 2012, 8:30 a.m. to 6 p.m.
  • Frankfurt Marriott Hotel
  • Hamburger Allee 2
  • +49 (0) 69-7955-0
  • Directions

You can get a 20% discount if you use the following code when registering:

TOCPartner20TSpeaker

I’ll be speaking about the jobs publishers are hired to do. Without giving too much away, here is my synopsis of the talk:

We’re inclined to “categorize” or “segment” media according to its attributes. We think of visual, auditory or written forms as distinct. Within each of these definitions of media we further sub-segment according to the way they are packaged. As in books, periodicals, or TV vs. film and albums and singles. These definitions are convenient because they describe the product and the product has evolved into a distribution chain and a therefore a market. It becomes therefore analogous to think of a book market and a TV market and a periodicals market as if these are what people actually desire.

But what people desire are more basic things. They desire to feel good or to be comfortable or to escape into fantasy or to be aroused. They have thirsts for knowledge or flights of fancy or needs for belonging. Authors and story tellers have sought to serve these needs for as long as we’ve been humans, regardless of the medium. When you step back and ask what the real “markets” are you realize that we’ve categorized according to technical and business means of delivering these needs.

Business theorists have a word to describe this categorization: segmentation according to product attributes. It’s a common practice to define markets according to products rather than what these products are hired to do. The great Harvard marketing professor Theodore Levitt used to tell his students, “People don’t want to buy a quarter-inch drill. They want a quarter-inch hole!” The idea that you can categorize by what consumers want to get done rather than what you are selling them is not new but it’s still a very hard thing to get your head around. It’s become known as “Job to be done” segmentation and has changed product planning for many firms. If you apply this method to your industry you realize that the products you sell are in competition not with other products like them but with completely new products. A newspaper may be in competition with Angry Birds and a TV show with FaceBook and a Movie with a cinematic themed video game.

If you take the history of story telling and job to be done analysis into consideration you realize that technology has always played a part in how stories are told and re-told. This technological progress is accelerating and we are now in an era where apps are the new medium which can encompass much of any of the previous story telling mediums. Apps are so flexible and so easily distributed and consumed that they threaten to converge multiple media types. I’ll explain how app economics are affecting not just games, but all forms of publishing.

Kindle Fire vs iPad: “Good enough” will not disrupt – Tools of Change for Publishing

Jenn Webb of O’Reilly writes:

With its recent release of the new Kindle Fire HD tablets, some have argued that Amazon has declared war on Apple and its iPad. But how serious is the threat? Are the two companies even playing the same game? I reached out to analyst Horace Dediu, founder and author of Asymco, to get his take. Dediu will speak on all this and more at TOC Frankfurt on October 9, 2012. Our short interview follows.

read the interview here: Kindle Fire vs iPad: “Good enough” will not disrupt – Tools of Change for Publishing. (O’Reilly Tools of Change for Publishing).

How many new Kindles will Amazon sell?

Amazon will sell as many Kindles as they make, but the number they will make will not be the most they could make.

The logic of selling a product which has a profit model unrelated to the cost of goods sold is tricky. The incentives are different. The risk is not selling too few but selling too many.

For this reason I think the total number of new Fire units to be sold has already been determined by a production order. You cannot think about the business from a demand point of view. If the product would be free then the demand would be infinite. The decision about how many will be “sold” will depend on the goodwill of the producer.

What Amazon tries to do with the brand is ensure that the Fire is in the hands of its most ravenous consumers. That is why it’s not sold in all markets or through all channels. They are sold through Amazon.com in the US (limited sales in UK as well). This is because a large number of the product in the hands of users who only use it for browsing or in areas where Amazon does not have content deals or where its ads are poorly targeted (e.g. India, Indonesia or Madagascar) would be a disaster. It may not be all that helpful to Google to have Android in those markets but as you would expect it’s still a profitable business for Apple.

So one way to think of the Fire is as a promotional item (aka swag) for another business (Amazon.com). Using this frame of mind, assessing its “threat” to another business which charges for the product itself is like assessing whether free t-shirts from trade shows affect the sales of clothing or apparel in general. They do, but mostly the sale of cheap t-shirts. I doubt that people stop buying more functional clothing because they have hundreds of free t-shirts. And then there’s the problem of looking like an advertisement.