In the recently posted US Smartphone Landscape I used comScore’s data to paint a picture of the growth of smartphones in general and the shape of the mobile platforms in the US. The source was survey data measuring the installed base. If we compare the installed base sequentially, we can get the increase (or decrease) of a particular platform. Comscore reports monthly but we can also summarize the data at a quarter-by-quarter basis.
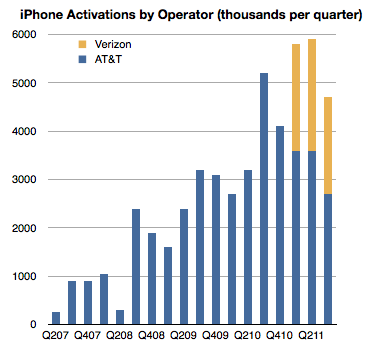
There is another source however for the US market, at least for the iPhone: operator activations. They report iPhone activations, shown below.
Can we use activations together with installed base data to learn something about the market? Yes, with some caveats.
First, it should be noted that install base should account for all sorts of devices. They could be new, old or hand-me-downs or purchased used. Changes in install base would come from addition of new devices but also from devices being discarded and users leaving the platform. Activations on the other hand include units new units but also those which have been re-activated after initial sale because they were either sold or given to other users. As far as I know operators do not report “net” activations so lost users are not included.
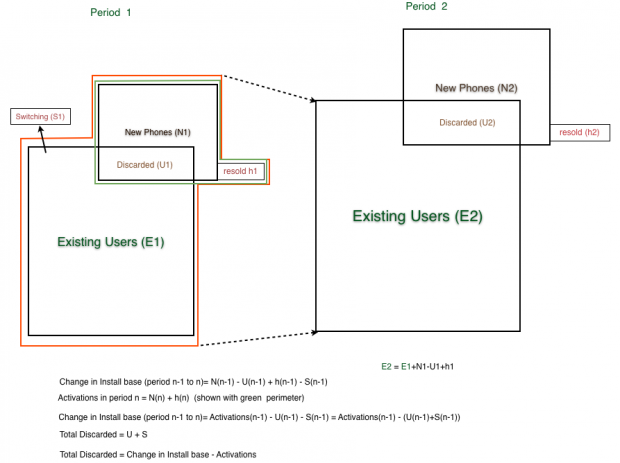
When the formulas are combined[1], what we get is the change in installed base is equal to Activations minus “discarded” iPhone, where “discarded” are both iPhones put aside in favor of a new iPhone or put aside in favor of another phone.
Since we have installed base change data and we have activation data we should be thus able to derive the number of iPhones being “discarded” or put out of use every quarter as the difference between activations and change in installed base.
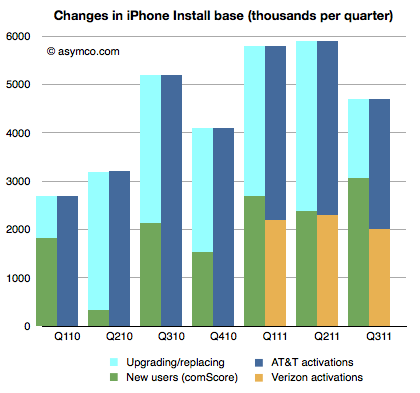
That allows the following chart to be built:
 The green, dark blue and orange areas are given inputs and the light blue area representing discarded phones is derived.
This is an interesting (new) piece of information. What it suggests is that at least in the US the discard rate, i.e. number of phones being discarded over number of new phones is about 50% (56% on average over seven quarters.)
It’s a rate I find surprising because I expected more of the phones to be re-used. But more surprising is that it leads to some surprising and possibly implausible behavior at AT&T.
If you look at the last three quarters, you can see that Verizon activations are very nearly equal to the increase in install base. As all Verizon users are new, they are certainly not replacing iPhones, so the green bars next to the yellow bars imply that all those new users are Verizon users. But that means that all the activations through AT&T were to replace existing phones and that AT&T only added a bit more than one million iPhone users in nine months.
In quarters prior to Verizon’s launch, the AT&T discard rate was a modest 60% on average and after Verizon launch it went to 81%.
What does it mean?
—
Note:
- The following diagram shows the derivation of “discarded” units.
Discover more from Asymco
Subscribe to get the latest posts sent to your email.


