The iPad Operating System

WWDC 2019 included a vast list of releases and it’s quite difficult to summarize. The focus is always on software updates but this year the list seems more exhaustive than usual.

The highlights for me are:

  1. WatchOS now includes direct App Store access. This continues the separation of the Watch from the iPhone, on a trajectory that remains predictable.
  2. Hearing Health/Noise App/period and trends management extends the iPhone’s health maintenance “jobs to be done”.
  3. AR & Swift extend the platform through Reality Kit and Reality Composer and Swift UI.
  4. MacOS improves through a new Apple Music app, Sidecar iPad integration, Accessibility and “Find My” Mac offline beacons.
  5. iPad and Mac are beginning to share Apps with Project Catalyst.
  6. New Mac Pro and new XDR Display are quantum leapfrog leaps in the high-end performance computing market where Apple has lagged for a few years.
  7. Sign-in with Apple is a huge and much needed update to identity management on-line. A big deal.
  8. iPadOS introduced as fifth Apple OS. Rather than merging iPad and Mac which would be suggested by Project Catalyst, Apple preserves and sanctifies the modularity of form factors based on their differences rather than commonalities.

If there is one thing I took away as most significant it would be the iPadOS spin-off. I don’t quite know how this will change the fortunes of the iPad but in declaring itself a platform distinct from iOS it signals that iPad can evolve rapidly in a new direction. The promise and problem with the iPad has always been that it was great hardware held back by software that was not able to take advantage of it.

The core apps, interfaces and connectivity were all constrained, which is not necessarily a bad thing. Constraints make a system and the constraints of the iPhone made it great. Not having a stylus, not having a menu system and not having windowing meant the UX had to be drastically simplified.

But apparently the iPad could not evolve without a re-evaluation of these constraints. The last iPad Pro release hinted at what was coming: it had a full-size keyboard and an immensely capable processor and screen.

So we saw new features such as split view for the same app, Files folder, doc sharing, USB and SD drives support, Zip/Unzip, Desktop class Safari optimized for touch. Download manager, custom fonts, new text editing gestures (copy/paste/floating keyboard). Pencil latency improvement. All these changes are geared toward “productivity” or Pro use.

And yet, the iPad is not Mac. It will remain separate and target Mac non-consumers. Indeed there are three times more iPad users than Mac users and it’s quite possible that the iPad base can expand further with enhancement into productivity.

The iPad has not proven to be either an iPhone or a PC killer. It’s just in between. It’s not a bowl and it’s not a swimming pool. It’s a bathtub. And yes, bathtubs are never going to be as common as bowls but they have their uses and are not obsoleted by better water containers.

The Operating System idea here is a bit of a conceit. In terms of the kernel and the core APIs there are vast common grounds between all Apple’s OSs. But what Apple calls an OS is not just the core code but also the positioning of the idea _to developers_. By branding iPadOS the company is signaling to developers that they should think about the iPad differently.

To a large extent they already do. Coding for iPad has always required a different design approach. But now perhaps Apple is drawing an explicit line enforcing the distinction.

Going back to the list of highlights above, none of them is a “home run”, re-enforcing the idea that the company has run out of big ideas. But hitting 8 base hits yields the same result as two home runs. There is a consistent delivery of improvements here that can’t be ignored. There’s something to be said for polishing rocks until they turn into gems.

The Pivot

The iPhone is the most successful product of all time.

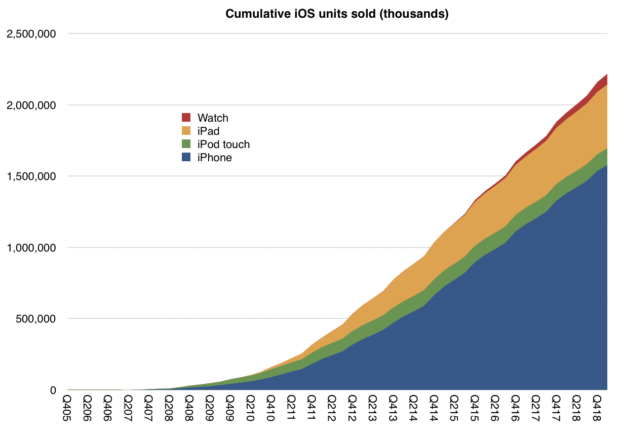
Over 1.6 billion have been sold. Including the iOS products it spun off, the total is over 2.2 billion. Of those 2.2 billion sold, 1.5 billion are still in use.

There are about 1 billion iPhone users.

Economically speaking, iPhone sales have reached one trillion dollars.1

Since the iPhone launched, Apple’s sales have totaled $1.918 trillion. Of those trillions about one half a trillion was accumulated in the form of  income.

Of that half trillion in income, $360 billion was paid out to shareholders2. and $131 billion was paid in taxes.

This sounds like a good business, but no business is good if it is static. What makes a business great is dynamism. The idea is to constantly maneuver for a new or enhanced way of doing business as technologies enable entrepreneurs to fundamentally change how value is captured or allocated.

The iPhone story isn’t static, the “pivots” or change in direction are several:

  • The App Store, a platform for collaborative innovation where millions of developers are offered the chance to improve the product.
  • Accessories, a licensing model for third-party hardware that works with the iPhone
  • Distribution through multiple channels
  • Integration with other Apple Products
  • The marketing of older products alongside new ones at reduced prices
  • An expanded product portfolio with a broader range of prices
  • Trade-in and financing options

Each of these initiatives contributed to the iPhone growth story but the biggest change in business model was the addition of services. Apple Services grew out of the iTunes business that pre-dates the iPhone and was established to provide content for the iPod.

In 2006, the year before the iPhone launched, Apple customers spent $3.3 billion on iTunes, Software and Services. By 2018 the spending rate was $80.5 billion/yr. It’s very possible that this year’s spending rate will reach $100 billion/yr. This new division is simply called Services today and consists mainly of third-party apps and third-party content sales as well as licensing.

Recently Apple launched a set of new services that it will offer itself. This includes television, films, financial services and news. Apple already has a music service of its own and file storage (iCloud) both of which are offered as subscriptions.

Apps are also allowed to offer paid subscriptions, and that total has reached 390 million, growing at 30 million a quarter with an expected total of 500 million by 2020. That amounts to one subscription for every other iPhone in use.

Some would argue that even with a $43 billion revenue rate, ($80 billion billing  rate)3 Apple’s business is still a hardware business and that comes with low margins, potential for disruption, non-recurring revenues and cyclicality.

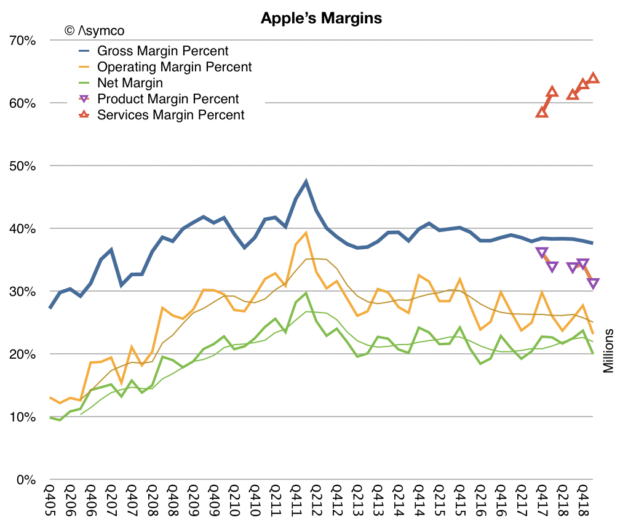
This is not the case. Apples’s business has high margins (64% gross margin for services, 34% for products), has been resilient over 12 years while attracting hundreds of imitators at lower price points, and has loyalty and satisfaction which results in more than 90% re-purchase rates. Cyclicality is driven by seasonality and product lifespans, not competition.


This common misconception of Apple is why it continues to be valued at a deep discount to not only peer companies who are services oriented (Google, Facebook, Microsoft and Amazon) but also at a discount to the overall market (the S&P 500).

Apple, since its inception, has always been oriented around its customers, not its products. The questions asked by management are “what can the company do to deliver experiences and satisfaction” rather than “what products can the company build”.

Every company is bound by its capabilities but the best companies re-shape these bounds because they are defined by priorities.

A priorities-driven company habitually re-designs its processes and its resources. A resources- or process-driven company re-designs its priorities as its capabilities change.

Moving as it does between computers, devices, software, services, retail, logistics and manufacturing means that it’s not classifiable as an “x” company where “x” is an industry sector. Rather, the company should be classified by the set of problems it seeks to solve (e.g. communications, community, productivity, creativity, wellbeing).

This disconnect between what people think Apple sells and what Apple builds is as perplexing as the cognitive disconnect between what companies sell and what customers buy.

Companies sell objects or activities that they can make or engage in but customers buy solutions to problems. It’s easy to be fooled that these are interchangeable.4

Conversely Apple offers solutions to problems that are viewed, classified, weighed and measured as objects or activities by external observers. Again, it’s easy to be fooled that these are the same.

This analysis is, of course, applicable to any company. Here I’m using Apple as a lens. This is because it’s just so much easier to tell this story with the narratives and anti-narratives that are so widely disseminated.

  1. The milestone of $1 trillion iPhone revenues was reached in the fourth quarter 2018 during which time the stock price of Apple fell by 40%. []
  2. As a result, the number of outstanding shares has decreased by 29% []
  3. The difference is in the way Apple accounts for App Store revenues: declaring only the 30% portion of sales that it keeps as revenues, and not including the 70% that is paid out to developers. The “billing rate” is what consumers spend, the “revenue rate” is what Apple reports. []
  4. They are only correlated. Purchase decisions are not *caused* by a product’s existence. The real cause is a combination of need and supply and time and circumstance of purchase. []

AiriPods

The Apple Watch is now bigger than the iPod ever was. As the most popular watch of all time, it’s clear that the watch is a new market success story. However it isn’t a cultural success. It has the ability to signal its presence and to give the wearer a degree of individuality through material and band choice but it is too discreet. It conforms to norms of watch wearing and it is too easy to miss under a sleeve or in a pocket.

Not so for AirPods. These things look extremely different. Always white, always in view, pointed and sharp. You can’t miss someone wearing AirPods. They practically scream their presence.

For this reason wearers, whether they want to or not, advertise the product loudly. Initially, when new, they looked strange, even goofy. But the product’s value to the wearer overcame any embarrassment and for those courageous enough to wear them, they became a point of pride. As all things distinctive enough, the distinction rubs on the user and that distinction begets new users and new distinction, and so on. So now we have a bona fide cultural phenomenon.

I have both my son and parents angling to get these things. I have not seen this universal appeal recently, even for the watch. You have to explain the watch. The AirPods explain themselves. The only thing which AirPods do remind me of is the original iPod. The iPod-and-white-earbuds had a similar signal/function ratio. Looks distinctive, works well, nails the job to be done and is self-describing. The “iconification” of white was the phenomenon of its decade.

One wonders how much of this behavior is by design or, more precisely, engineered by designers. Did Jony Ive’s team plan on users “flexing” with their AirPods? Did they make them distinctive on purpose with the stalks pointing down vs,, for example, wrapping around the back of the ear for a more discreet look? Was it just good luck and the form followed function? It’s hard to imagine that taste could be engineered but here we are.

Whether planned or not, the newest AirPods offer a functional upgrade with no visual upgrade. This is noteworthy because whatever they got right with the original design they decided not to mess with it. You can’t tell if someone is wearing the newest AirPods or the originals.

As far as the added functionality it is typical Apple: faster connections due to a new chip, longer talk time, longer listen time, voice-activated Siri and wireless charging. Broadly speaking they are just better in ways that need to better and not better in ways they are good enough.

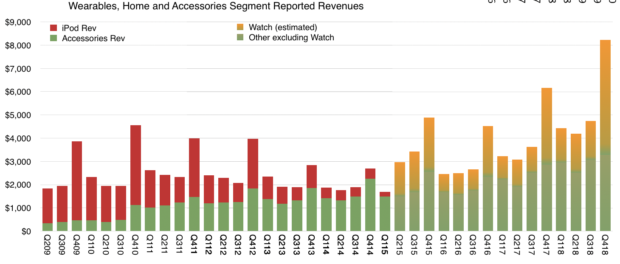
The product is part of the “wearables” category at Apple which includes watch and is growing almost 50%/yr. and not from a small base either. The following graph show the history of the segment since 2009 (before the iPod peaked).

As can be seen, Wearables and Home segment grew out of the iPod segment, through “Other” products and is now almost double what the iPod used to be alone.

It should be noted that the AirPods can be paired directly with the Apple Watch and used independent from the iPhone. If not from this point alone, culturally the iconic white AirPods and jewel-like Apple Watch embody the spirit of the iPod.


mini

We want things to get better. The desire of improvement and an increase in performance is seemingly innate. The old adage goes that using the word “new” is the most effective way to increase sales. “New & Improved” if you want to be redundant.

For many in technology, New & Improved means faster with more of every measurable parameter. More memory, more pixels, more storage, more bandwidth, more resolution. In devices, the tendency has been to communicate “new & improved” through an increase in screen size. We are subject to this to such an extent that phones are becoming unusable with one hand, stretching screens to the edge of the device and then wrapping those screens around the edges and then even folding the screens so that we have to unfold or unroll to use the product. Maybe an origami phone is in the works.

But there is a parallel movement where “New & Improved” means smaller. This is the trend to miniaturization. Smaller is better because it’s more portable, more conformable. Things sold by the ounce are better than things sold by the pound. The best computer, the best anything, is the one you have with you and having it with you is more likely if you can take it with you. So that which you can take with you is the best. QED.

Apple has had a great history of miniaturization. The original Macintosh was tiny compared with personal computers of its day. It had a handle so you could take it with you. Apple pioneered laptops with breakthroughs in utility and form which made them truly portable. The iMac followed with a degree of integration and portability which made it iconic. Of course the iPod and iPhone were marvels when they first appeared.

Over the years these products expanded into ranges with “good, better, best” type segmentation. The bigger being the best in performance and the smaller typically being the most convenient. However it seemed that the positioning was toward “bigger is better” for a lot of these products. The iPhones Plus, the iPads Pro, etc. As even the largest were getting thinner, the “mini” versions appeared to be neglected. You could get “good enough” portability from the larger products so why bother with the minis.

It came to a head when the iPhone SE was discontinued last fall. Its demise felt like the end of an era. I always considered the SE as the “Steve Edition”. It was the last design Steve Jobs was involved in and it pained me to see it go. With it seemed to go the positioning around “mini”.

But also last fall we saw a re-boot of another almost-forgotten mini: the Mac mini. For me the Mac mini was quintessentially Jobsian. I remember that he loved tiny products. His launch of the iPod nano was spectacular; reaching into his jeans’ watch pocket to pull it out on stage. Holding the Mac mini up as if a tiny tray. Even the iPod shuffle was a quirky and lovable idea1. And let’s not forget the Mac Cube which made the iMac look huge.

When the Mac mini was released last fall in Brooklyn with a huge spec bump and a thunderous reveal I thought something was up. When the MacBook Air was also out at the same event I felt that the company was signaling something. Perhaps a re-dedication to the low end.

Also in parallel there is the wearables product line. The AirPods and the Apple Watch are jewelry. The essential qualities of products you wear are that they be small and beautiful. The smaller the better. Above all, both the Watch and AirPods are marvels of miniaturization. They pack so much in so little volume and that volume is shaped in such an aesthetically elegant way that they become daily essentials. I use my Apple wearables more than any other Apple product. Watch glances and time with AirPods exceeds the iPhone unlocks and iPhone use time. The fact that we don’t even realize that the smallest Apple products are also the ones we use most is a testament to their conformability to us.

So the Mac mini that is suddenly the Mac Maxi in performance, the MacBook which is an extraordinarily small laptop, the wearables success, all pointed in a direction that the iPhone did not: that “mini” was back.

And now we see the iPad mini being re-launched with a huge spec bump. We should take the hint. The iPad mini is just charming. I have been trying it out for a few days and it has worked its way into my routine. I have an iPad Pro that I use on a desk to design presentations (and to deliver them). I use it with a keyboard for dealing with email on my lap or on a plane and take it instead of a laptop when going to meetings.

But the iPad mini worked its way to my nightstand. It the one I reach for when on a couch. It is like an iPhone but when you’re at home it’s better than the iPhone because you can linger on that new true tone screen. It works well one handed. It now has Pencil support so it can be used for sketching and doodling.

I am an analyst not a product reviewer but I sense how it fills a gap between iPhones and larger devices–in a home setting. Of course it can be used in an office. It is much easer to take with you if you carry a laptop in a bag.

Fundamentally explaining mini is pointless. mini is something that is felt more than it is perceived. You can see the attraction of a tiny product only when you come face-to-face with it. In a picture it’s hard to get it–there is no frame of reference. What draws me to a MacBook or to a mini or a Watch is when it’s touched and held and carried or worn. The experience of the product is not how it works but how it works with you. You have to be part of it. It’s not asking “Does it look good?”. It’s asking “Does it look good on me?” mini means more personal.

That is the nature of mini and that is why I love the new minis: the iPad mini, the Mac mini, the MacBook (mini) and that is what I dare to hope that there is an iPhone mini coming.

  1. probably the first Apple wearable as you could actually pin it to your clothes []

A Billion Users

In the latest Apple Earnings report, Apple announced a few details that are relevant to the forecast of the business:

  • The global active installed base for iPhone reached an all-time high at the end of December, surpassing 900 million devices. This represents growth y-o-y in each of five geographic segments, and growth of almost 75 million in the last 12 months alone
  • There are now over 360 million paid subscriptions across the Services portfolio, an increase of 120 million versus a year ago. Apple expects to surpass 500 million in 2020.
  • The installed base grew to 1.4 billion devices by the end of December. This includes all-time highs for each of the main product categories and all five of their geographic segments.

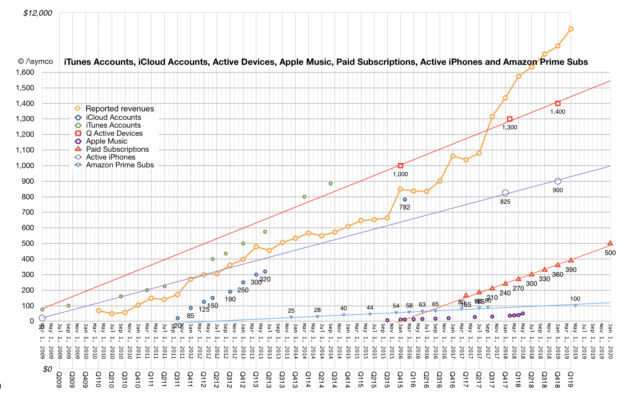
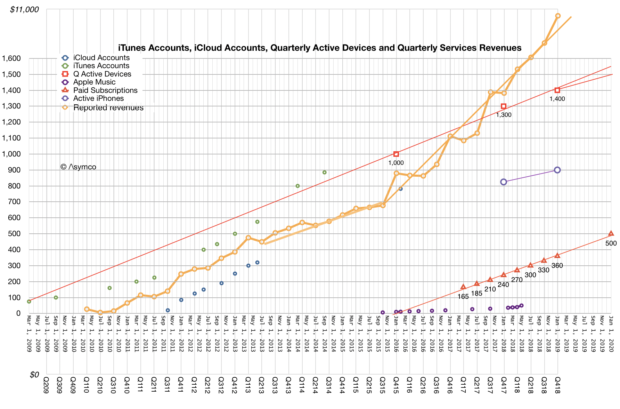
I added all these data points to the previous reported figures related to installed base, subscriptions and Services revenue.

Note that all the data sets show a linear growth path. Most prominent is the paid subscriptions line which is growing at exactly 30 million per quarter. The new projection of 500 million by 2020 is exactly in-line with this projection.

Note also that active devices and iPhones are on similar trajectories. The figure for active iPhones is interesting because it very closely relates to active users. It’s extremely likely that 900 million active iPhones means 900 million active iPhone users. An iPhone is useful if it has a data plan associated and it’s a costly proposition for most people to have multiple devices and multiple data plans.

This close relationship between iPhone usage and iPhone users means that we can approximate the entire unique user base for Apple. There might be “10s” of millions of users who use Apple devices but don’t use iPhones but there might also be multiple iPhones for some users1

So it’s very likely that the total Apple user base is between 900 and 1 billion. If it’s not 1 billion now then it’s very likely it will be 1 billion within 12 months.

In May 2010 I made the prediction that Apple would reach a billion users in 5 to 8 years. The prediction was based on the first 100 million iOS users. The company reached one billion active devices in a bit over 5 years and is about to reach 1 billion users 8 years since.

Apple stated in the latest conference call that very little of Services revenues depends on the any previous quarter’s unit sales confirming that Services is driven almost entirely from the user base. With almost a billion users, 90+% loyalty rate, 95% satisfaction, 120 million paid subscriptions and 75 million new users/yr, the analysis of Apple as a services company is becoming interesting.

  1. I would be inclined to assume that there are more non-iPhone Apple users than multiple iPhone users. []

Preview of the holiday quarter

Every October, at the end of its fiscal year, Apple files its Form 10K or annual report. In this report the company includes a section titled “Capital Assets” which details expenditures for capital equipment. This is last year’s entry:

The Company’s capital expenditures were $14.9 billion during 2017. The Company anticipates utilizing approximately $16.0 billion for capital expenditures during 2018, which includes product tooling and manufacturing process equipment; data centers; corporate facilities and infrastructure, including information systems hardware, software and enhancements; and retail store facilities.

Note that there are categories of spending detailed and that their order might indicate the degree of such spending, suggesting that product tooling and manufacturing equipment is likely to be the costliest category.

After this report, during subsequent quarters the company may update this forecast of spending. In the last (third fiscal) quarter the entry was as follows:

The Company’s capital expenditures were $11.1 billion during the first nine months of 2018 . The Company anticipates utilizing approximately $17.0 billion for capital expenditures during 2018, which includes product tooling and manufacturing process equipment; data centers; corporate facilities and infrastructure, including information systems hardware, software and enhancements; and retail store facilities.

Note that the forecast of $16.0 billion was updated to $17.0 billion and the first 9 months’ expenditures were $11.1. Since there is only one quarter remaining1 it’s reasonable to assume that the company’s forecasts are more likely to be precise and that therefore the difference between total expected spending and already spent, i.e.f $5.9 billion remains to be spent.

The actual spending is not recorded quarterly but an approximate value is reported in the Cash Flow statement as “Payments for acquisition of property, plant and equipment”. That can be tracked but it does not equal exactly the capital expenditure. For example, the quote above says expenditures were $11.1 billion through first 9 months but the total of all payments for acquisition of PP&E is $10.272 billion.

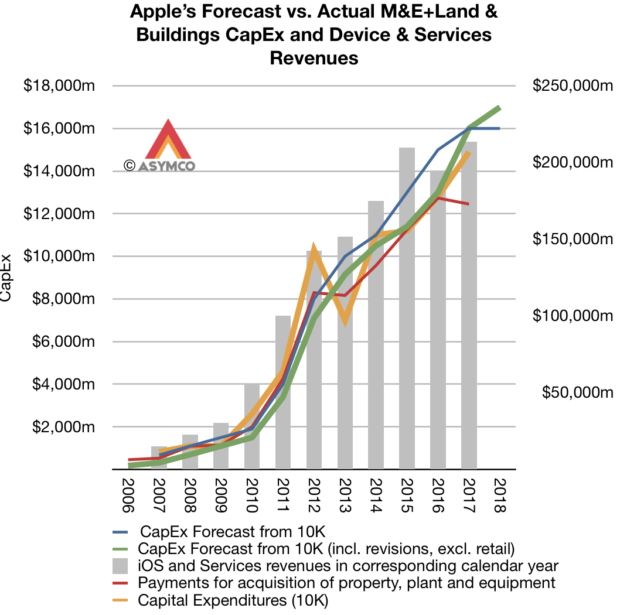
Minor2 differences, aside, this forecast and actual spending and payments data is significant because it is highly correlated to Apple’s overall business. Assuming that the spending on manufacturing equipment and information systems hardware (i.e. data centers) is in support of the iOS device sales and services we can try to show how sales correspond to spending with the following graph:

Here sales are shown as a bar graph and the various spending forecasts and actual payments are shown as lines. Also note that the spending and sales are offset by one quarter. The fiscal year is used for spending and the calendar year for sales. The reason is that spending is presumed to lead sales by approximately one quarter.

There are some notable discrepancies, especially with the 2012/2013 period when spending was brought forward a quarter thus showing a surplus to forecast in 2012 and a deficit in 2013. But apart from that, there is a broad correlation between spending and sales.

This means that the CapEx forecast in October is a good indicator of sales in the following year.

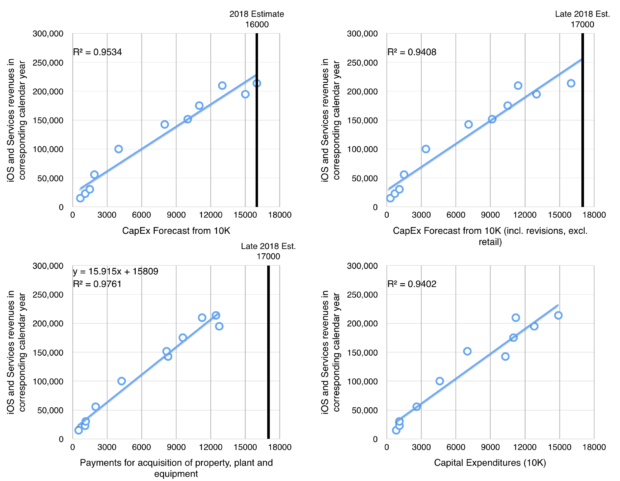
In fact, the relationship is can be shown with four scatter plots, one for each of the published figure:

I caution that this is a yearly forecast and it is revised through the year on a quarterly basis, sometimes up, sometimes down. It’s therefore not a perfect indicator and of course the relationship between sales and spending is not perfectly predictable. Note that there are four types of spending that can be measured, two are forecasts (one year and revised) and two are actuals (cash flow payments and reported total expenditures)

We can measure the best variable that fits the sales data through the coefficient of determination or R-squared. The best fit seems to be with Payments for acquisition of property, plant and equipment (R-squared of 0.976).

This gives the formula for yearly sales as 15.915x + 15809 where x is the expected total spending. That spending to date has been $10.272 billion and it’s probably going to exceed $16 billion for the year.

Using $16 billion spending total, we can calculate iOS products and services for calendar 2018 of $270.45 billion.

iOS and Services sales to date have been $103.2 billion with an estimate for next quarter of about 54.3 billion (based on guidance) and thus a total through Q3 of $157.5 billion. Subtracting this from the $270.45 billion expectation from the calculation above gives a fourth calendar quarter iOS revenue of $113 billion.

Adding $7 billion for the Mac results in a total net sales of 120billion. This therefore is what I’d put forward as a reasonable target for CQ4.

Note that this is equivalent to a growth of 36% from the 2017 fourth quarter.

[UPDATE: Original version used total sales rather than iOS related products and services (i.e. excluding Mac). The text has been edited to reflect the correct figures.]

  1. and since at the time the quarterly report is filed, only about 2 months remain in the quarter []
  2. To the extent that $1 billion can be considered minor []

Just in Time

The iMac launched May 6 1998, exactly 20 years ago. It is not the most significant computer to ever exist. It was a clear descendant of the original Mac which established the “all-in-one” desktop computer category. That category, to which it still belongs, is a modest segment. The last time Apple reported portable sales separately was in late 2012 when the desktops/servers and pro systems combined made up only 20% of all Mac sales by units. If iMac were 10% of Mac sales, it would represent about 2 million units in 2017.

Desktops evolved into laptops and personal computing evolved into pocket  computing. Becoming more personal means more intimacy and this is leading to wearable computing. There is more beyond that to be sure.

But the iMac is a historically significant machine. It allowed Apple to start on a new trajectory. It did this by first offering a financial lifeline. Sales of Macs, which were at the time the only source of revenues for Apple, increased from 2.7 million to 3.8 million a year. This at a time when Windows PCs were shipping about 100 million units. That was enough to ensure survival. Today Mac units are five times higher while Windows PCs are about 2.5 times higher. The following graph shows the impact of iMac on the Mac’s trajectory.  Continue reading “Just in Time”

The Number

The first number that Tim Cook mentioned in the fourth quarter investor conference call was the number of active Apple devices. The 1.3 billion monthly active devices is the most important measure of the health of Apple’s business. It’s the primary way the company chooses to measure itself and it’s the best instrument available to understand the company’s strategy.

This is only the second time this number was revealed. The previous figure, given in January 2016, was 1 billion active devices. Thus, while Apple sold 586,744,000 devices1 the number of active devices increased by 300,000,000. While the number of units sold is frequently updated and attracts a lot of attention, the number of units active is very infrequently updated and attracts little attention. Yet the number of active devices speaks of the future of the company and should be carefully scrutinized while the number of devices sold speaks of the past and should be cursorily glanced at.

Dr. Edward Deming once said that the numbers that best define a company are two factors that do not appear on any financial statement. These factors are the value of a satisfied customer and the value of a dissatisfied customer. These factors must be multiplied by every other number in a financial statement in order to assess the prospects of the business. A high satisfaction leads to repeat purchases and referrals, growing the business; while a low satisfaction leads to ending relationships and a repulsion of potential new customers.

These numbers determine everything about the future and nobody quite knows what they are.

It’s tempting to suppose that, by asking, you can find out if customers are satisfied. Certainly the company cites these answers to the question of satisfaction and it’s partially useful to have some data. But customers are people and people are social beings. They are flawed in that they want to be liked and will use their powers of deduction to determine whether what they say will lead to their being liked more. Thus they will say things which they judge the listener will want to hear.

This auto-suggestion is especially likely when the answer (satisfaction) is so difficult to ascertain and the feeling is so fleeting.

You can’t rely on surveys alone to know if people like your product. You have to base that number on what they do.

This is where the active device data comes in.

A liked product will be used and a well-liked product will be used more. Usage is valuable not just in its intensity but also in its duration. When you see activity of a device it’s always a good sign if that is both frequent and long-lasting.

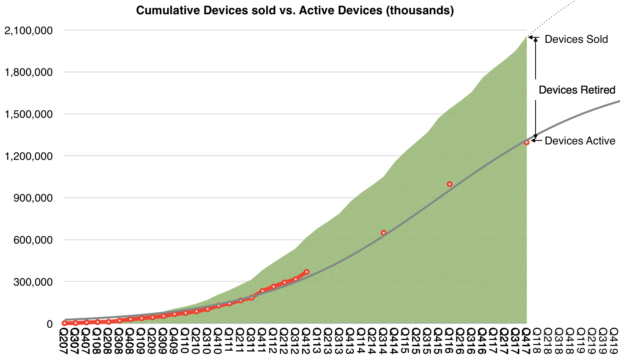
The following graph shows the history of cumulative devices sold by Apple since mid-2007, when the iPhone was launched. That total is now 2.05 billion devices. I have added early estimates on the number of active devices (in red) based on assumptions about product life-span. I added the company’s own reported figures since then.

I then tried to paint a continuous curve for this active number using a logistic function which assumes a diffusion into a population of addressable users, shown as the grey line above. The logistic curve is a good tool because it has a solid theoretical foundation in social behaviors.

The formula for this line is S÷(1+EXP(−1×(tog)) where S is the point of saturation or maximum population size, t is the period or count of quarters (1 for Q1 2007 and 2 for Q2 2007, etc), o is the offset to 50% or the point of inflection, in quarters, and g is the growth factor.

The S-curve above corresponds to S=1.8 billion, o=35 and g=8.

I chose these parameters because they best fit the data. It does not mean the reality will be precisely this but this is the best guess so far. It implies that there will be about 1.8 billion active devices sometime close to 2022 and tells us how we get there. This can and will change but for now this is the best guess using a theory that has worked in similar circumstances.

Working backwards from this active base estimate, we have predictive power on units sold, and even on revenues. However this is not the whole story. It’s not even the main story. What matters is what it tells us of the relationship between past behavior (purchases) and future behavior (use, referral, repeat purchase). This is hinted at by the ratio between purchases and active devices. In other words, the ratio between cumulative units and active units tells us whether the products are used and for how long. Having a continuous estimate of active uses allows for a reliable measure of satisfaction.

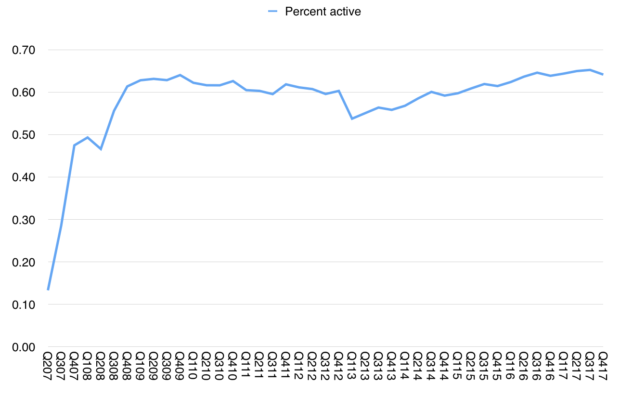
The following graph shows this estimate.

Note that the ratio remains remarkably constant. It’s currently about 64%. It’s so constant that perhaps we can invent a rule of thumb which says that two out of every three devices ever sold by Apple is still in use. And that this rule is always true.

This begins to be interesting.

The staying power and predictability of the business2 comes from a guarantee that activity is rigidly tied to purchase.

This speaks more than any satisfaction survey. It’s a measure of actions based on interaction rather than words based on human frailty.

There is no better number available to predict Apple’s business.

  1. This is an estimate that includes Macs, iPhones, iPads and Apple Watch but does not include Apple TV or accessories such as AirPods. []
  2. i.e. Free cash flow []

Apple Remarks to Investors in FQ1 2018 Earnings Conference Call, Categorized and Annotated

The following is a transcript of the comments from Tim Cook (CEO) and Luca Maestri (CFO) at Apple’s Q1 2018 Earnings Conference Call February 1, 2018. I color coded my interpretation of the comments into four categories:

  • Grey: Background and promotional commentary
  • Red: Strategy and signals of what management considers important and may include data beyond the regularly reported numbers.
  • Green: Financial data
  • Black: Commentary.
  • Blue: My commentary, in brackets.

For a quick read of Apple’s strategy, read the Red text. These comments are not repeated in financial reports. Highly recommended.

For a quick read of Apple’s financial performance, read the green text (which are replicated in financial reports). Read this if you don’t want to wade through the financial reports.

For marketing or product material, read the grey text.This is sometimes unique but also repeats product launch information.

—-
Tim Cook:  Thanks, Nancy and thanks everyone on the call, and welcome to everyone today. Before we dive into the quarter, I’d like to take a moment to talk about a significant milestone we recently crossed.

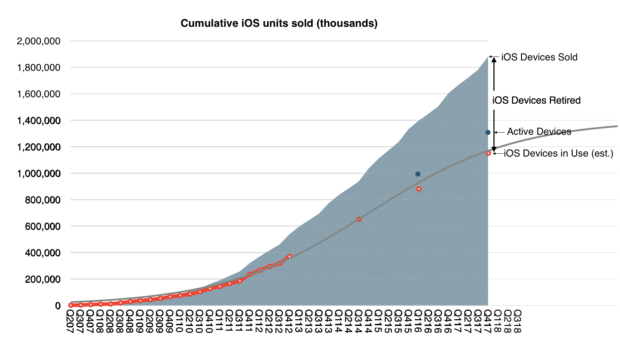
Apple’s active installed base reached 1.3 billion devices in January and is at an all-time high for all of our major products. 1.3 billion devices represents an astonishing 30% growth in just two years. It speaks to the strength and reliability of our products and our ecosystem, as well as the loyalty, satisfaction and engagement of our customers. It’s also fueling tremendous growth in our services business, which I’ll talk about a little later in the call. [This is probably Apple’s most important number. For at least the next 20 years this is the key performance metric and it can be used to derive company’s valuation. A summary of the history of active devices vs. units sold is shown in the graph below:]
Turning to the December quarter. We’re thrilled to report Apple’s biggest quarter ever, which set new all-time records in both revenue and earnings. We generated revenue of $88.3 billion, which is above the high-end of our guidance range, and it is up almost $10 billion or 13% over the previous all-time record we set a year ago.

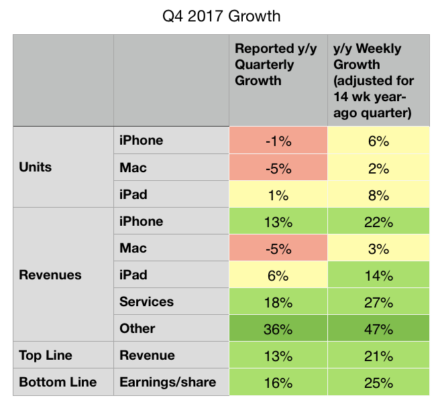
It’s also our fifth consecutive quarter of accelerating revenue growth with double digit growth in each of our geographic segments around the world. What makes us even more remarkable is that the quarter we’re reporting today was 13-weeks long, while the year ago quarter was 14-weeks. When we look at the average revenue per week in the December quarter this year compared to last year, our growth was a stunning 21%. [The 13-week vs. 14-week year-on-year comparison is repeated several times. The summary differences are shown in the table below:] 
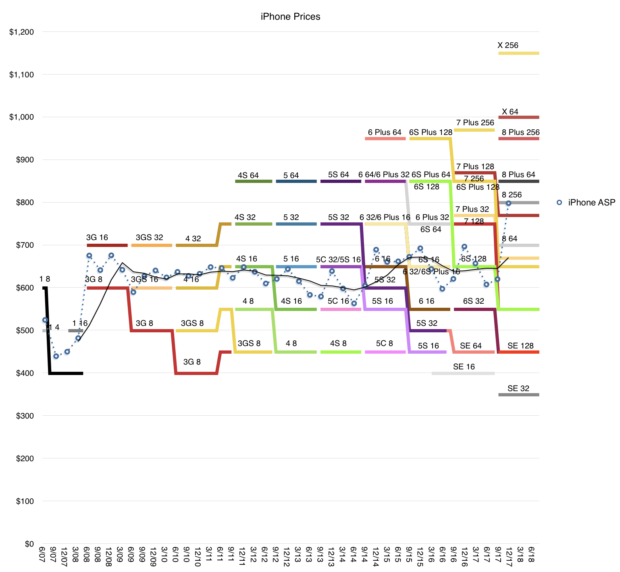
Our growth was broad-based and a key driver was iPhone, which generated its highest revenue ever. iPhone X was the best-selling smartphone in the world in the December quarter according to Canalys, and it has been our top selling phone every week since it launched. iPhone 8 and iPhone 8 Plus rounded out the top three iPhones in the quarter. In fact, revenue for our newly launched iPhones was the highest of any lineup in our history, driving total Apple revenue above our guidance range. [The iPhone X is a huge hit. It drove the average selling price $100 higher y/y. This is not only unprecedented for Apple but for the entire Industry. The average smartphone sells for less than $300 while iPhones sold for $800. The gap is widening. The following graph shows the product mix and the average resulting price.] 
I want to take a moment to recognize the tremendous amount of work that went into creating iPhone 10. Our teams carried out an extremely complex launch from both an engineering and operations perspective, executing an outstanding product ramp that required years of research and development; one that introduced innovative features like an edge-to-edge Super Retina Display and the TrueDepth Camera, which enables face ID. Our customers love these new features and the new gestures like simply swiping up from the bottom, which make using iPhone even more intuitive and enjoyable.

Our team has put the technology of tomorrow in our customers’ hands today, set a standard for the next decade of smartphones and we are very proud of their achievements.

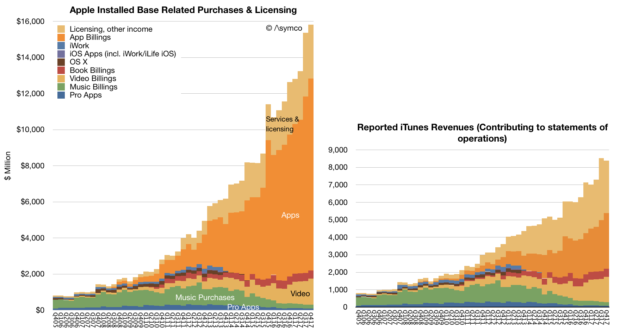
It was another very strong quarter for services with revenue of $8.5 billion, up 18% over last year, and we’re on pace to achieve our goal of doubling our 2016 services revenue by 2020. The number of paid subscriptions across our services offerings passed 240 million by the end of the December quarter, that’s an increase of 30 million in the last 90 days alone, which is the largest quarterly growth ever. [Services has been growing relentlessly for over a decade. This steadiness of growth makes is a juggernaut. Apple is increasingly speaking about subscriptions as the key metric and 240 million is reaching record territory. The rise of Services is shown below (both revenues and consumer spending.)]

We had an all-time record quarter for the App Store with our best holiday season ever. We’re seeing great excitement around augmented reality with customers now enjoying over 2,000 ARKit enabled app, spanning every category in the App Store. In December, when Pokémon GO released its new augmented reality features built with ARKit, it jumped the top of the App Store charts. Last week, on a stop in Toronto, I met developers who are hard at work on creative applications using ARKit from art appreciation to ecommerce, and I was very impressed with what I saw.

Just for months after ARKit launched to the public, we’ve already released ARKit 1.5 in beta to developers around the world, and the response has been tremendous. Augmented reality is going to revolutionize many of the experiences we have with mobile devices. And with ARKit, we’re giving developers the most advanced tools on the market to create apps for the most advanced operating system running on the most advanced hardware. This is something only Apple can do.

In addition to the App Store, several other services had their biggest quarter ever, including Apple Music, iCloud and Apple Pay, all of which saw growth in both active users and revenue.

Apple Pay has reached an important milestone in the U.S. As a result of 50% year-over-year growth in merchant adoption, it’s now accepted at more than half of all American retail locations, which includes more than two-thirds of the country’s top 100 retailers. Now available in 20 markets, global Apple Pay purchase volume more than tripled year-over-year and we’re delighted to be expanding to Brazil in the coming months. [There are no absolute data points on Apple Pay but we do have some scattered growth data. The US data is cited here but in my experience it’s more popular in select countries like UK where users are using it habitually]

Today, you can use Apple Pay to take the subway in Guangzhou, China, see a concert at London’s Wembley Stadium or buy a souvenir in Yosemite National Park. In the U.S., we launched Apple Pay Cash in December, and it’s off to a terrific start. Millions of people are already using it to send and receive money with friends and family quickly, easily and securely; to split a bill, pay someone back, or send last minute gift right from the messages app.

It was our best quarter ever for the Apple Watch with over 50% growth in revenue and units for the fourth quarter in a row and strong double-digit growth in every geographic segment. Sales of Apple Watch Series 3 models were also more than twice the volume of Series 2 a year ago. Apple Watch is the most popular, smart watch in the world and gained market share during the quarter based on the latest estimates from IDC. [Apple Watch is growing consistently. The following graph shows my estimates of volume (total 42 million to date) and revenues (total $15 billion) based on all available data and commentary from management.]

It was the third consecutive quarter of growth for iPad revenue, thanks to the strength of both iPad and iPad Pro. Based on the latest data from IDC, we gained share in nearly every market we track with strong outperformance in emerging markets.

Worldwide, almost half of our iPad sales were the first-time tablet buyers are those switching to Apple, and that’s true in some of our most developed markets, including Japan and France. In China, new and switching users made up over 70% of all iPad sales.

For Mac, we launched the all new, iMac Pro in mid-December. It’s an entirely new product line designed for our Pro users who love the all-in-one design of iMac and require workstation class performance. It’s the fastest, most powerful Mac ever, delivering incredible computational power, for simulation and real time 3D rendering, immersive VR and complex photography audio and video projects. Worldwide, 60% of our Mac sales were the first time buyers and switchers and in China, that number was almost 90%.

We’re looking forward to getting HomePod in customers’ hands beginning next week. HomePod is an innovative wireless speaker, which delivers stunning audio quality wherever its placed in the home, thanks to the advanced Apple engineered hardware and software.

Together with Apple Music, HomePod gives you instant access to one of the world’s largest music catalogs. And with the intelligence of Siri, it’s a powerful assistant you control through natural voice interaction. We’re very happy with the initial response from reviewers who’ve experienced HomePod ahead of its launch, and we think our customers are going to love this new product.

We believe one of the key issues of the 21st century is education. And because of that, we’ve strengthened our commitment and investment into initiatives like everyone can code. To find the innovators of the future, we need to nurture the students of today. Our App Development with Swift curriculum, which is available free on iBooks, has been downloaded more than 1.2 million times worldwide with almost half of those coming from here in the United States. It’s also being taught in dozens of community colleges across the country, putting practical skills in the hands of today’s jobs seekers.

I was in London two weeks ago as we announced that the program was expanding to more than 70 colleges and universities in Europe. Millions of students around the world will have the opportunity to add Swift to their coding vocabulary and gain skills that are essential for today’s economy.

This is an exciting time at Apple and with the best lineup of products and services we’ve ever had and a set of initiatives that show how business can be a force for good in the world. We could not be more excited about our future.

Now, for more details on the December quarter results, I’d like to turn over the call to Luca.

Luca Maestri: Thank you, Tim. Good afternoon, everyone. Our business and financial performance in the December quarter were exceptional, as we set new all-time records for revenue, operating income, net income and earnings per share.

Starting with revenue, we’re reporting an all-time record, $88.3 billion, up nearly $10 billion or 13% over the prior record set last year. It is our fifth consecutive quarter of accelerating revenue growth. As you know, the December quarter a year ago spanned 14-weeks compared to 13-weeks this year, which is important to consider as we have set the underlying performance of our business this year. When we look at average revenue per week, our growth rate was even higher at 21% with growth across all product categories for the third consecutive quarter.

Our results were terrific all around the world with double digit revenue growth in all our geographic segments, an all-time quarterly record in the vast majority of markets we track, including the U.S., Western Europe, Japan, Canada, Australia and Korea, as well as Mainland China, Latin America, The Middle East, Central and Eastern Europe, and India.

In Greater China, we were very happy to generate double digit revenue growth for the second quarter in a row and in emerging markets outside of Greater China, we saw 25% year-over-year growth.

Gross margin was 38.4% at the high end of our guidance range. Operating margin was 29.8% of revenue. Our net income was $20.1 billion an all-time record, and up $2.2 billion over the last year. Diluted earnings per share were $3.89 also an all-time record and cash flow from operations was very strong at $28.3 billion.

During the quarter, we sold 77.3 million iPhones, the highest number ever for a 13-week quarter. Average weekly iPhone sales were up 6% compared to December quarter last year with growth in every region of the world despite the staggered launch of iPhone 10. We established all-time iPhone revenue record in nearly every market we track with double-digit growth in all of our geographic segments. iPhone ASP increased to $796 from $695 a year ago, driven primarily by the launch of iPhone 10 and the success of iPhone 8 and 8 Plus.

We exited the December quarter towards the lower end of our target range of five to seven weeks of iPhone channel inventory with less than 1 million more iPhones in the channel compared to the December quarter a year ago, in line with our growth in average weekly unit sales. Customer interest and satisfaction with iPhone are very, very strong for both consumers and business users.

The latest data from 451 Research indicates U.S. customer satisfaction ratings of 96% or higher across iPhone models. In fact, combining iPhone 8, iPhone 8 Plus and iPhone 10, consumers reported an amazing 99% satisfaction rating. And among business customers planning to purchase smartphones in the next quarter, 77% planned to purchase iPhone. Our customers are also incredibly loyal with Kantar’s latest U.S. research, reflecting a 96% iPhone loyalty rate, the highest ever measured. [Customer satisfaction is the second most important figure after active user base. Combining these two figures yields the recurring revenue value of the company. Remember what Deming said: the most important measurements for a company’s value are the multipliers of a satisfied customer and a dissatisfied customer–these numbers never appear on any financial report but they are applied to all the numbers on every report].

Turning to services. We had a terrific quarter with revenue of $8.5 billion, up 18% year-over-year and up 27% in terms of average revenue per week; that is an acceleration to the 24% services growth run rate that we experienced in the September quarter.

The App Store set a new all-time revenue record. The Store’s all-new design is off to a fantastic start with quarterly store visitors, transacting accounts and paying accounts, reaching new all-time highs. During the week beginning December 24th, a record number of customers made purchases or downloaded Apps from the App Store, spending over $890 million in that seven-day period, followed by $300 million in purchases on New Year’s day alone.

And according to App Annie’s latest report, the App Store continues to be the preferred destination for customer purchases by a very wide margin, generating nearly twice the revenue of Google Play. Across all our services offerings, paid subscriptions reached $240 million with growth of 58% over last year and they were a major contributor to the overall strong growth in services revenue[Apple has half the user base of Google Android. This is based on Google’s May 2017 report of 2 billion active devices vs. the 1.3 billion that we just got from Apple. And yet these users collectively spend twice as much on apps. This ratio of “half the users, twice the spending” has been cropping up in individual developer anecdotes and can also be seen in other metrics of engagement and consumption. This should not be surprising as it conforms to the Pareto distribution of economic value.]

As Tim mentioned, it was our best quarter ever for Apple Watch. And when we add to this us from Beats and AirPods, our total revenue from wearables was up almost 70% year-over-year. In fact, wearables were the second largest contributor to revenue growth after iPhone, which is impressive for a business that started only three years ago. In total, our other products category set a new all-time record with quarterly revenue exceeding $5 billion for the first time[Wearables now includes more than watches but watches are likely still the dominant product.]

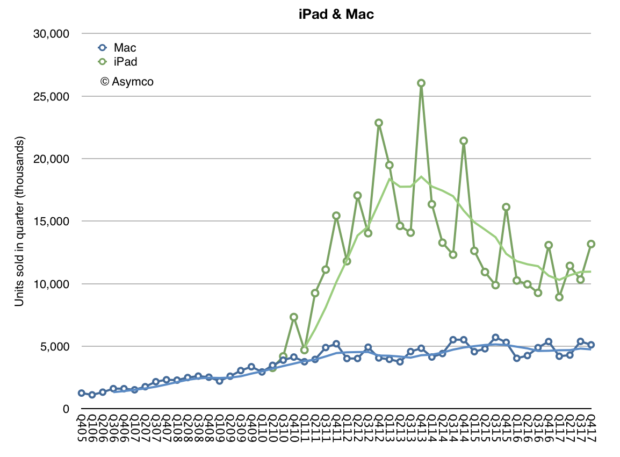
Next, I’d like to talk about the Mac. We sold 5.1 million Macs during the December quarter, which translates to a 2% year-over-year increase in average sales per week. Mac performance was particularly strong in emerging markets with unit sales up 13% year-over-year and with all-time records in Latin America, in India, Turkey and Central and Eastern Europe. On a worldwide basis, the active install base of Macs was up double-digits year-over-year to a new record.

It was also another growth quarter for iPad. We sold 13.2 million units with average iPad sales per week up 8% over last year’s December quarter. iPad sales grew strong double-digits in many emerging markets, including Latin America, the Middle East, Central and Eastern Europe and India, as well as developed markets, including Japan, Australia and Korea. The active install base of iPad has grown every quarter since its launch in 2010, and it reached a new all-time high in December, thanks to extremely high customer loyalty and large numbers of first-time iPad users. [iPad is clearly recovering from a long decline. ASPs are rising as it’s being positioned as a PC alternative. Its low end functions are being absorbed by large screen iPhones.]
NPD indicates that iPad had 46% share of the U.S. tablet market in the December quarter, up from 36% share a year ago. And the most recent surveys from 451 Research found that among customers planning to purchase tablets within 90 days, 72% of consumers and 68% of business users planned to purchase iPads. Customer satisfaction is also very high with businesses reporting a 99% satisfaction rating for iPad.

We are seeing great traction in enterprise as businesses across industries and around the world standardize on iOS. For example, Intesa Sanpaolo, one of Europe’s leading banks, has chosen iOS as the mobile standard for its entire 70,000 employee base in Italy; choosing iOS for its security, user interface, accessibility and reliability, Intesa Sanpaolo will deploy native apps to improve employee productivity in customer support, human resources, and marketing across the company.

And LensCrafters, one of the largest optical retail brands in North America, will be using over 7,000 iPad Pros to enable digital eye exams and digital optical measurements in a personalized and interactive experience. We’re also rolling out a new initiative, called Apple AtWork to help businesses implement employee choice programs more easily and offer Apple products company-wide.

Resources from both Apple and our channel partners will enable enterprise IT and procurement teams to buy or lease Apple products more efficiently, streamline the setup of iPhone, iPad, and Mac, and deliver a seamless onboarding experience for employees. We launched the program with CDW in the U.S. last week, and we would be expanding to more channels and regions later this year.

The December quarter was extremely busy for our retail and online stores, which welcomed 538 million visitors. Traffic was particularly strong during the four-weeks following the launch of iPhone 10, up 46% over last year. And across the quarter, our stores conducted over 200,000 today at Apple sessions, covering topics including photography, music, gaming, and app development, and art and design. Just last weekend, we opened our first store in Seoul, Korea and we’re looking forward to opening our first store in Austria in a few weeks. These newest openings will mark the expansion of our retail store presence to 21 countries.

Let me now turn to our cash position. We ended the quarter with $285.1 billion in cash plus marketable securities, a sequential increase of $16.2 billion. $269 billion of this cash, or 94% of the total, was outside the United States. We issued $7 billion in debt during the quarter, bringing us to $110 billion in term-debt and $12 billion in commercial paper outstanding, for a total net cash position of $163 billion at the end of the quarter. We also returned $14.5 billion to investors during the quarter. We paid $3.3 billion in dividends and equivalents, and spent $5.1 billion on repurchases of 30.2 million Apple shares through open market transactions.

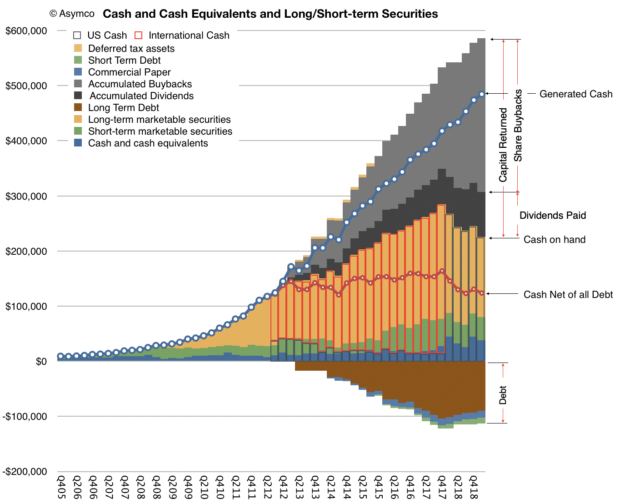
We launched a new $5 billion ASR program, resulting in initial delivery and retirement of 23.6 million shares and we retired 3.8 million shares upon the completion of our 12th ASR during the quarter. We’ve now completed over $248 billion of our $300 billion capital return program, including $176 billion in share repurchases against our announced $210 billion buyback program with $34 billion remaining under our current authorization[An updated look at Apple’s cash is shown below]
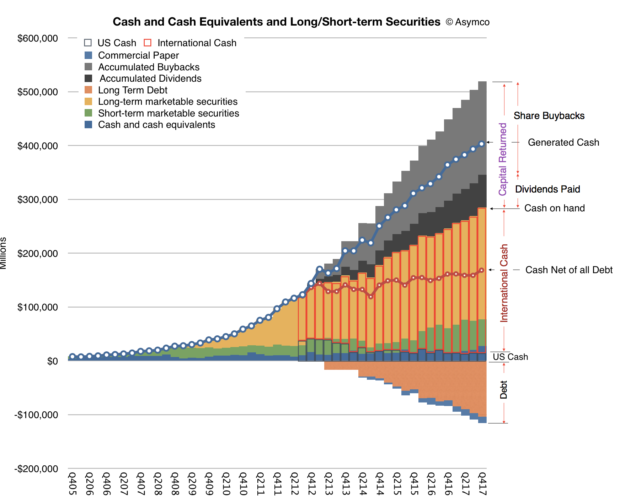
Turning to taxes. Due to the recently enacted legislation in the U.S., we estimate making a corporate income tax payment of approximately $38 billion to the U.S. government on our cumulative past foreign earnings. This amount is very similar to what we had been accruing on those earnings in our financial results through fiscal year 2017, including the $38 billion payment. We will have paid over $110 billion of corporate income tax on our total domestic and foreign earnings during the last 10 years for a cash tax rate of about 26%. [Apple has paid more tax than any company in history, and is about the make the largest single payment to the US Treasury.]
Our tax rate of 25.8% for the December quarter was close to our guidance of 25.5% as the lower U.S. statutory rate from the new legislation was effective offset by the remeasurement of deferred tax balances.

As we move ahead into the March quarter, I’d like to review our outlook, which includes the types of forward looking information that Nancy referred to at the beginning of the call; we expect revenue to be between $60 billion and $62 billion; we expect gross margin to be between 38% and 38.5%; we expect OpEx to be between $7.6 billion and $7.7 billion; we expect OI&E to be about $300 million; and we expect the tax rate to be about 15%.

Tax reform will allow us to pursue a more optimal capital structure for our company. Our current net cash position is $163 billion. And given the increased financial and operational flexibility from the access to our foreign cash, we are targeting to become approximately net cash neutral overtime. We will provide an update to our specific capital allocation plans when we report results for our second fiscal quarter, consistent with the timing of updates that we have provided in the past.

Finally, today our Board of Directors has declared a cash dividend of $0.63 per share of common stock, payable on February 15, 2018, to shareholders of record as of February 12, 2018.

The iOS Economy, Updated

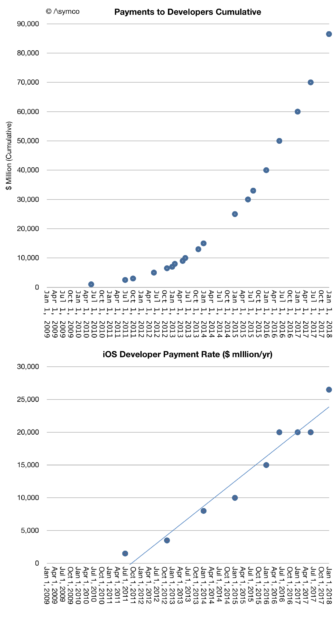
In its latest update on the App Store Apple reported that iOS developers earned $26.5 billion in 2017. A year ago the figure was $20 billion. The growth rate is then about 33%. The cumulative payments to developers can be calculated as $86.5 billion. This amount was generated in a span of less than 10 years, with the first billion paid by June 2010.

The following graph shows the history of cumulative payments and the corresponding payment rate (in $/yr.)

Note that this represents the payment to developers, not the spending by the customer. Apple keeps about 30% of the revenue.  The total spending on the App Store is then about 43% higher.1. The equivalent figures for spending on the App Store are shown below. Continue reading “The iOS Economy, Updated”

  1. During the last year some types of app subscriptions have been priced by Apple at 15% of gross so I adjusted the payment rate to 72% for 2017 []