
On October 27th, Nintendo published half year results for the fiscal year ending in March 2012. Management stated that the company lost over $900 million with a negative outlook. Nintendo cited weaker than expected sales of Nintendo DS hardware and 3DS software and Yen appreciation as the main reasons for the miss. Is this the end of Nintendo?
Before we look more closely, here is a quick summary: The company is exclusively involved in selling game hardware and software. Their console platform is the Nintendo Wii, which will be followed by the Wii U late in 2012. The Nintendo DS and Nintendo 3DS are the company’s portable game consoles. The Wii and the DS are nearing the end of their product cycles. On the software side, the company is known for gaming titles such as Super Mario and Zelda. Nintendo also pioneered the licensing model to allow third-party developers to produce games for its hardware products.
A closer look
The good news for analysts is that Nintendo publishes their estimates for hardware and software unit sales. This allows us to measure management predictive accuracy. The red line (management forecast) should be as close as possible to the dark green pillars (realized unit sales in the fiscal year).
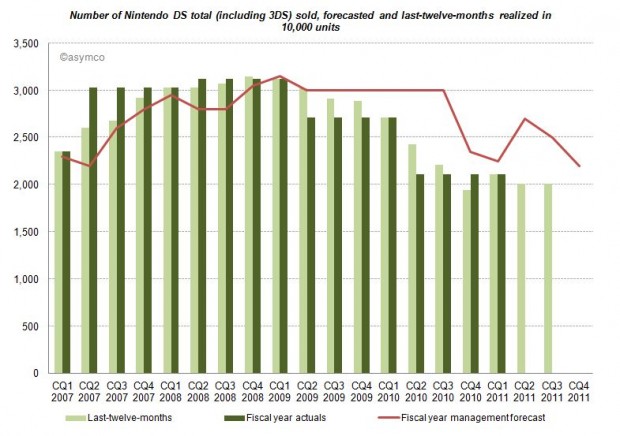
Until CQ1 2009 devices sales grew in excess of forecasts. A similar pattern can be found for consoles and game titles. After Q1 2009 forecasts have been always higher than results, and more worryingly, the deviation between forecast and sales is widening. Management missed and lowered forecasts for two consecutive years. Management’s hope for an increase on the back of initial 3DS sales in the launch quarter (CQ1 2011) did not come to pass and they subsequently lowered forecasts again in the following two quarters.
Looking at all categories, management lowered forecasts almost continuously. The deviation remains the largest in the portable hardware business segment indicating that management was largely surprised about the development.
What caused this reversal of fortune?
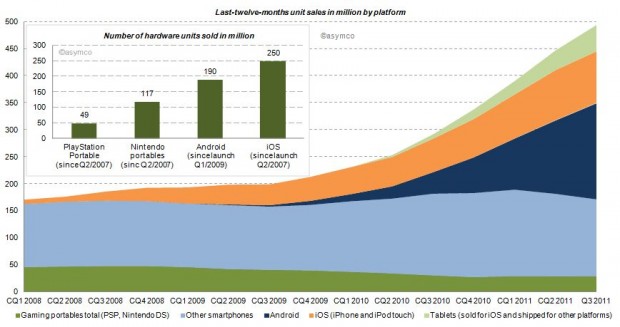
Two years earlier the iPhone had launched and by CQ1 2009 iOS reached an installed base of about 38 million, half the number of Nintendo portables in the same period. Furthermore, in CQ1 2009 Android phones came to the market. Smartphones (light blue area of the chart below) sold before (and after) the debut of iOS, but the iPhone redefined the category and an avalanche of smarter phones running iOS and Android followed (blue and orange area). Portable gaming devices from Nintendo and Sony declined ever since: 17% in 2009, 31% in 2010 and already 16% in the last twelve months.
How do the game players stack up?
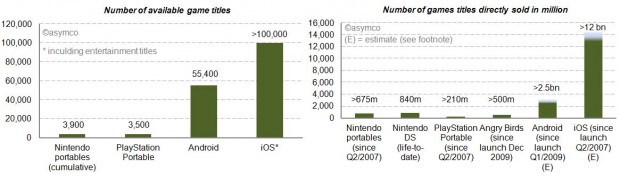
We already looked at the installed base in the chart above. iOS and Android have outsold Nintendo portable units by a factor of 2.1x and 1.6x. Furthermore, we can see (in the charts below) that the two main mobile platforms have 14 to 26 times more game (and entertainment) titles available. Nintendo and Sony also publish unit sales of directly sold software titles. For Android and iOS we know the cumulative app download statistics. By taking the share of Septembers’ paid and free app downloads as a proxy, we can conclude that also by this measure Android and iOS dwarf Nintendo and Sony [1]. The reach of iOS and Android is further underlined by the more than 500 million downloads of Angry Bird game titles – first released only two years ago – for any platform having sold more than twice the amount of Sony’s cumulative portable game titles and almost as many as Nintendo’s cumulative games titles since Q2/2007.
Who else has skin in the game?
Besides Nintendo, Sony, Apple and Google, who else is making a push into mobile gaming? Before investigating, let’s first have a closer look at Sony. Sony, just like Nintendo, is also active in stationary gaming segment with the PlayStation franchise. The Sony group also has access to entertainment most notable through Sony Pictures Entertainment and Sony Music Entertainment. Furthermore, Sony recently decided to buy Ericsson’s stake in the mobile phone joint-venture Sony Ericsson and is making a push with Android to bring its gaming titles as a differentiator for its own products to the platform. And the other major suspects? Microsoft, also active in the stationary gaming segment with its Xbox franchise, is pushing to bring the Xbox experience to mobile phones with Windows Phone. Amazon has retailed software and games for years and has started to distribute software and games via direct download on its own Kindle devices but also for the Mac. On the Kindle, Amazon is relying on a forked Android version on which it leverages its eBook and other entertainment assets. And then there is Facebook, a social network that wants to be on any platform or device. Out of 800 million users, 350 million access Facebook via a mobile device. Around 50% of Facebook members play games on the desktop. With Project Spartan, Facebook is aiming to bring the desktop experience to the mobile device including a stronger focus on gaming and video.
The competition between Apple and Google is already asymmetrical. Including the other contestants in the competitive landscape reveals Nintendo’s key weaknesses in the portable gaming market: attraction as a platform for developers in terms of ease and reach, pricing of hardware competing with operator-subsidized mobile phones and the jobs-to-be-done or value preposition. The new generation of mobile devices is standing against Nintendo’s dedicated approach. Although slowly adding features such as a browser and “app store” to its portables, Nintendo devices fall short in the variety of jobs-to-be-done compared to smartphones, let alone making a call.
Average selling prices and financial impact
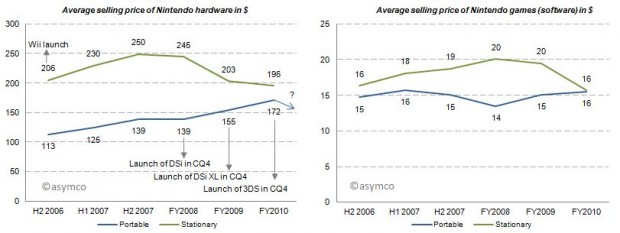
With this market pressure one would imagine that average selling prices decreased for Nintendo portables. But for the last three fiscal years average selling prices for portables have increased, all things equal, mainly due to new product launches. Game title’s average selling prices have remained relatively flat. Note that these are wholesales prices for hardware and a mix of retail and wholesale prices for games. In 2011, for which we do not have data yet, the price of the newest portable, Nintendo 3DS, was lowered from its U.S. debut of 320 250$ in February to 170$ in July which will have a negative impact on ASP going forward.
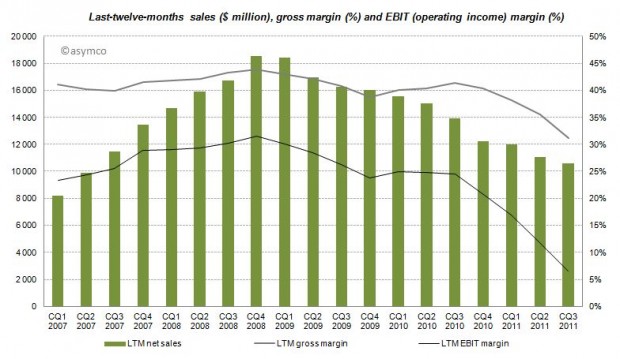
The effects of Nintendo’s rigid strategy and the fast changing competitive landscape are manifested in the devastating financial performance over the recent quarters with LTM sales, gross margins and EBIT margins declining starting from CQ4 2008 and even accelerating to decline after CQ3 2010.
Furthermore, even though the company has recognized its own difficulties, Nintendo has no intention of adjusting its strategy:
CEO Iwata on the question of whether Nintendo plans to bring its game library to other platforms:
This is absolutely not under consideration. If we did this, Nintendo would cease to be Nintendo. Having a hardware development team in-house is a major strength. It’s the duty of management to make use of those strengths. It’s probably the correct decision in the sense that the moment we started to release games on smartphones we’d make profits. However, I believe my responsibility is not to short term profits, but to Nintendo’s mid and long term competitive strength.
Although realized and obvious, the disruption’s invisibility is often manifested in the paralysis of the incumbent.
Conclusion
According to Isaacson, Steve Jobs apparently always worried who could eat Apple’s lunch. The lunch of the iPod, he concluded, was ripe for mobile phones. Subsequently, Apple entered the mobile phone space. Google followed. Since then more powerful mobile phones have eaten the lunch of the dedicated gaming device. The jobs-to-be-done and their priorities in people’s life have not changed, but the tools people use to get them done have. Permanently.
—
Notes:
- Estimated by multiplying total cumulative app downloads with September’s share of game downloads: For iOS ranging from 72-80% based on Top 150 free and paid app downloads, for Android ranging from 38-47% respectively. This is a very crude estimation, but the gist of it is that 4% for iOS and 11% for Android game downloads as percentage of cumulative app downloads would outsell Nintendo.
Discover more from Asymco
Subscribe to get the latest posts sent to your email.