There are several methods I turn to when estimating device sales.
Top-Down Demand analysis
The first is to look at so-called top-down views of the demand. This method takes a view of the overall phone market and assumes share for smart devices and, further, shares for individual platforms. There are several estimates out there. The most recent is Ericsson’s Traffic and Market Data Report, released November 7 2011.
It concludes that in five years’ time mobile subscriptions will reach 8.4 billion of which smart devices (incl. tablets) will total 6.2 billion. As iOS has approximately a 250 million install base at end of 2011 and as the total base from Ericsson’s estimate for 2011 is 1.44 billion then Apple’s share is approximately 17%. If we assume that Apple will be able to increase smart device share to 20% (3 percentage points in five years) then by 2016 Apple will need to have 1.24 billion iOS subscribers.
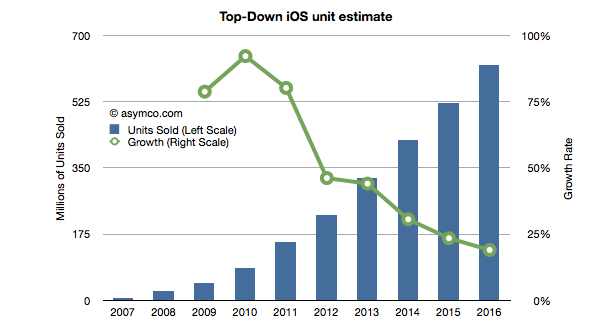
Assuming that half the installed base upgrades every year and Apple adds devices required to reach the install base necessary (1.24b or 20% share) leads to the following unit sales projection (I’ve added 2008 through 2010 actuals and 2011 estimates based on my own current Q4 projections).
This Approach yields an estimate of 225 million iOS devices to be sold in 2012. Note that the growth is linear which is not usually the case. Typically this growth is in the form of an S-curve which front-loads the volume in the more recent periods.
Production Estimates
The second approach is to look at supply. I use this method for Apple as I consider their devices to be supply constrained and thus look at historic performance to forecast their production ramps. Put another way, I try to answer the question of how quickly Apple can sustain growth in production given their yearly product cycles. I can also use capital expenditures (which the company releases in advance) to forecast device production as the two have been closely correlated in the past.
Using this method I currently estimate 260 million iOS units for 2012.
Customer behavior estimates
The third approach is to attempt to measure customers’ loyalties and competitiveness of vendors. If we know the probability of upgrades and the historic split between “new” and “existing” users then we can roll the forecast forward.
To start, we need a probability of upgrade which can be obtained from surveys which measure “loyalty” by asking the intention of sticking with the brand on the next purchase or a measure “satisfaction”. iOS product score in the high 80% to 90% range.
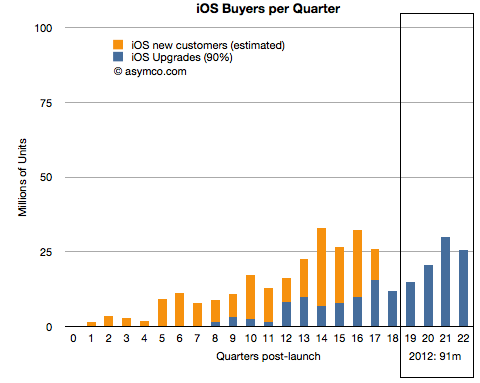
The following chart shows total iOS units sold and the ratio of upgrades (assuming 90% upgrades for 2 year old purchases). It also forecasts upgrades based on current installed base.
If 90% of iOS users upgrade two years after their device purchase then next year will result in 90 million iOS devices sold to existing users.
Given the ratio of new users to upgrades in the past, and if we assume some reduction in that ratio over time, we can obtain a measure of “new users” on top of the upgrades. (In other words we forecast forward the ratio between the dark blue and orange lines above).
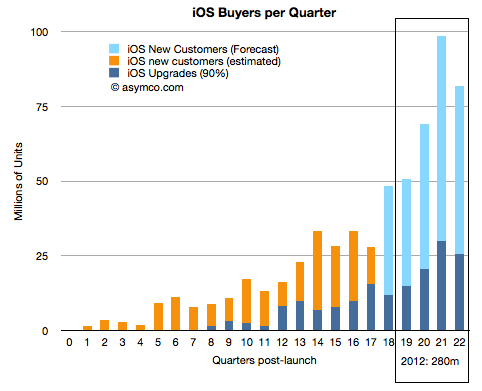
The ratio of new to upgrades has varied significantly from 30x to 0.8x upgrades. I created a schedule where the next quarter will be 2.1x, then 1.44x, 1.36x, 1.28, 1.2x for the quarters of next year. The result is shown below:
This yields a forecast of 280 million iOS devices to be sold in 2012. The forecast is very sensitive to the ratios shown above so obviously this is not going to be very accurate but it’s interesting to note that the three methods yield growth rates of 46%, 69% and 82%. All three are far above the growth forecast for Apple (about 25%).
Discover more from Asymco
Subscribe to get the latest posts sent to your email.


