The curious case of slowing US growth for Android

The latest data from comScore MobiLens is showing an uncharacteristic slowing in smartphone growth. In the survey period ending November, the number of smartphone users in the US was 91.4 million. This is equivalent to 39.1% penetration, an increase of 0.6% (i.e. up from 38.5% in the last period.)

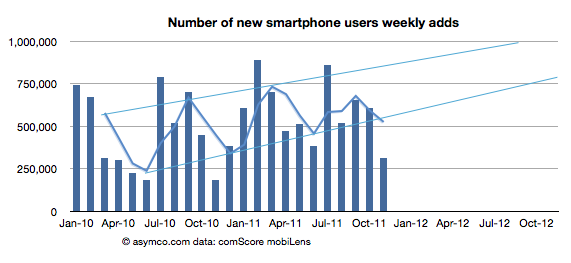
The growth is equivalent to 1.4 million new smartphone users (i.e. users who switched from a non-smart device for the first time.) The problem is that this is half the growth of the previous period. The following chart shows the growth as the weekly add rate.

As you can see, the growth has fallen to a level not seen since 2010. The cause may be seasonal as last November was also a slow month. I added a three month moving average which shows that although there seems to be seasonality, the last period did not show the peak of previous periods.

To better understand what happened, I looked at the performance by platform. The following chart shows the net user gains by platform. Continue reading “The curious case of slowing US growth for Android”

5by5 | The Critical Path #19: The hiring and firing of milkshakes and candy bars

In this episode I talk with Bob Moesta, a pioneer of Job To be Done research. We go over the theory and process of understanding what products are really hired to do and ask why this understanding is so hard to come by.

In a discussion rich with examples from multiple industries Bob illustrates how marketing, design and engineering are all dancing around the question of how product should be developed.

Could the universally accepted compartmentalization of corporate functions be a root cause of product failure?

via 5by5 | The Critical Path #19: The hiring and firing of milkshakes and candy bars.

You can follow up with Bob here: The Re-wired group.

Discerning Apple's international product positioning through the big Mac index

Thanks to all those who contributed to the big Mac index there is a substantial amount of pricing data available in one location.

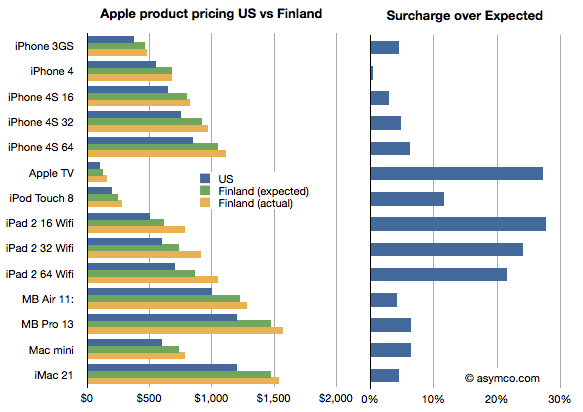
The analysis that I hoped to perform on the data was to see if Apple was pricing specific products differently in international markets. It was prompted by some apparently anomalous pricing of the iPhone 4S in Brazil.

To summarize, the idea is to calculate the “expected” price of an Apple product by taking the untaxed US price and adding duties and tariffs and taxes to determine what that product “should” cost in another country. Then taking the difference between this “expected” price and the actual price to determine if Apple is using pricing to signal in a particular market.

The analysis basically eliminates the effect of government on price and leaves currency and actual pricing signals from Apple as variables.

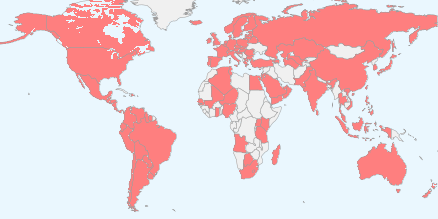
The analysis is not simple because there are many obscure tax rules. Some products are taxed differently in the same country. I have not completed the country-level analysis but have been able to see some averages over the countries reported (total of 45 reports.)

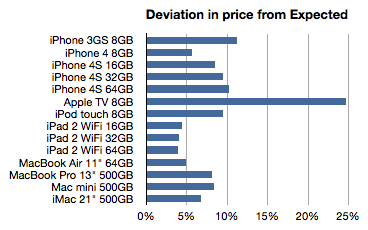
The following chart shows the average deviation from “Expected” as a percent:

Here are some potential interpretations of this data: Continue reading “Discerning Apple's international product positioning through the big Mac index”

5by5 | The Critical Path #18: Who's Paying for My Lunch?

Dan and Horace ponder why some companies are more mysterious than others. We ask whether transparency and simplicity of business models is a sign of strength or weakness. We compare the measurement, creation and capture of value and why we should celebrate the mortality of businesses.

via 5by5 | The Critical Path #18: Who’s Paying for My Lunch?.

Notes:

Who is being reasonable now?

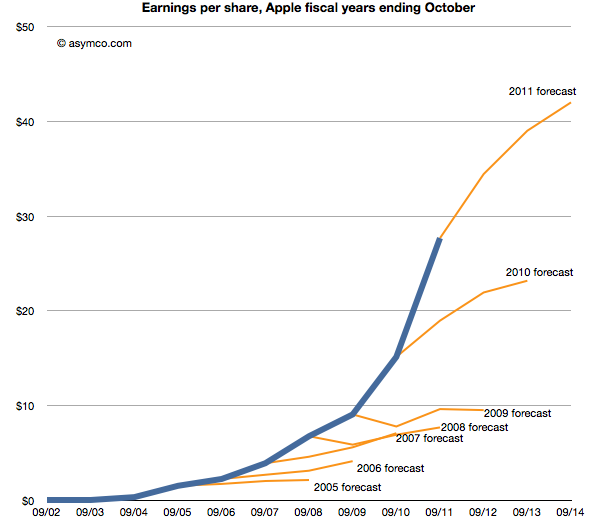
Last week Horace wrote about the apparent “reasonableness” of analyst Apple estimates. He explained how the consensus for Apple’s growth was always deeply pessimistic because its performance could be argued to be anomalous. It was just too good to be true. We reproduce the chart here:

The estimates look like characteristic “tell-tales” of a company running strong into the wind.

This conservatism in the face of rapid growth sounds “reasonable” but is it always practiced? And what about the ability of this conservative strategy to predict dramatic changes in growth? To test, we started to look at the predictions for RIM. RIM has also enjoyed strong growth over a similar time frame as Apple. How did analysts predict its performance? The following chart was prepared using the same technique as the one for Apple[1]. Continue reading “Who is being reasonable now?”

5by5 | The Critical Path #17: Working with Clay

Horace interviews James Allworth, author, Fellow at the Forum for Growth and Innovation at Harvard Business School, and a former Apple employee. James describes what it’s like working with Clayton Christensen and takes us on a journey through the latest academic and applied research being conducted on the theories of disruptive innovation.

via 5by5 | The Critical Path #17: Working with Clay.

How many Android phones have been activated? (Updated)

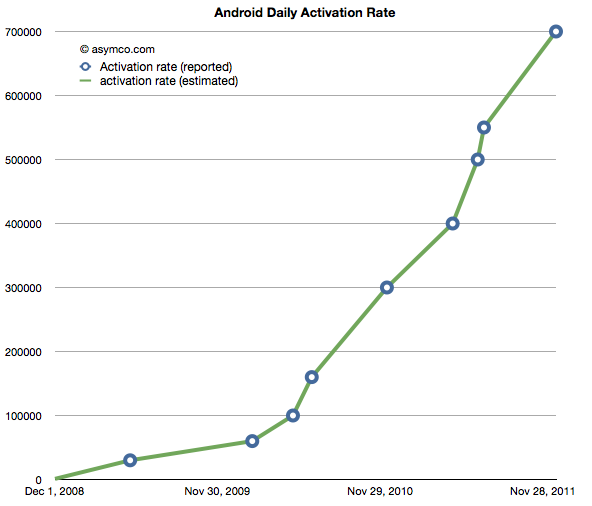
The following chart shows the reported (circled points) and estimated (lines) for Android activations. The resolution of the sampling is every seven days.

If we take these estimates and then compile a cumulative total of activations we get the green line in the chart below. Continue reading “How many Android phones have been activated? (Updated)”

The big Mac (and iPad and iPhone) index (Updated)

Apple’s products are globally consistent. They sell the same exact[1] product in all countries. An unlocked iPhone is the same everywhere. It makes the products “liquid” in that they can be easily bought and sold across borders.

However, laws do not permit the import and friction-free trading of electronic products. In addition to regulations there are duties levied and there are sales or consumption taxes levied on the purchase.

However, knowing the retail price of an Apple product in a particular location, and knowing the tax and duties levied, can we work out if the price is consistent?

Here is an example:

I illustrated the price of a basket of Apple products in the US online Apple store Continue reading “The big Mac (and iPad and iPhone) index (Updated)”

The parable of RIM

Here are the highlights from RIM’s latest quarter:

  • 14.1 million BlackBerry smartphones shipped, 13 million sold through
  • 150k PlayBook shipped with sell-through slightly higher. 800k PlayBooks shipped so far.
  • BlackBerry subscriber base up to 75 million
  • High growth cited for U.K., France, South Africa, Mexico and Argentina, Indonesia, Saudi Arabia and South Africa. RIM is the #1 smartphone vendor in the Latin America and Caribbean region. Sales outside the US, UK and Canada were 61% of revenues. US is now 20% of sales, UK 11%.
  • Hardware growth outside the US was 56%
  • There are 630 carriers
  • 50k apps in App World with 5 million downloads per day
  • Forecasting 11 to 12 million smartphones next quarter

Given the channel fill with a new product, the device business was marginal at best. The company obtained -1% growth y/y in units but 31% sequential growth from a transitional quarter. The average selling price (inclusive of service revenues) is $354 and about $280 excluding service revenues. I estimate that operating margins have dropped to about 11%. Not a good story, but one we have been warned to expect.

But a crucial new twist to the story is that RIM announced that they don’t expect new BlackBerry 10 devices until late next year. That came as a surprise and the stock sold off significantly, valuing the company at well below book value.

Stepping back, the biggest surprise is that the company seems to have had no plan for sustaining itself.

Let me explain. Continue reading “The parable of RIM”