5by5 | The Critical Path #50: From Impossible to Inevitable

The crumbs of data falling off the Samsung v. Apple trial table get some scrutiny. Horace expands on some of the hints from the partial release of information and then continues with a discussion of how market data is collected and whether it should be trusted. That leads to a question of whether private (or paid) analysis is “better” than public (and unpaid). The benefits of having access to the vastness of collaborators online and the public sources of info might be tipping the balance. Finally, we talk about how big ideas go from sounding impossible to being inevitable and who gets rewarded for making them so.

via 5by5 | The Critical Path #50: From Impossible to Inevitable.

American exceptionalism

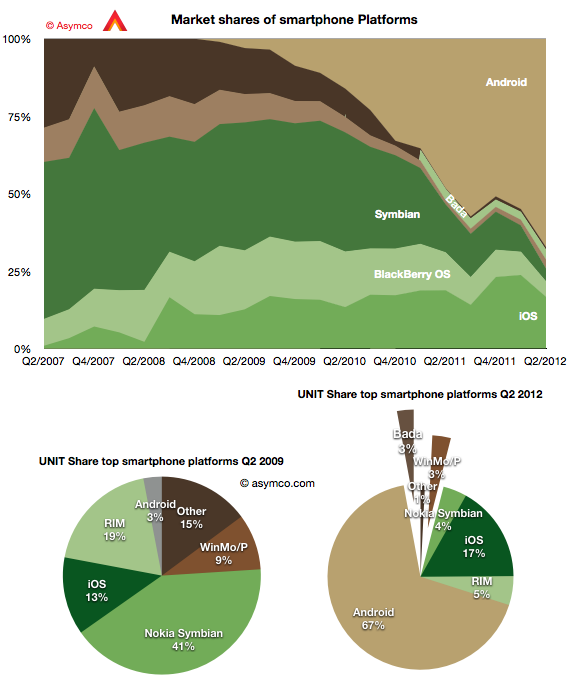
The second quarter showed continuing growth for Android with 19 points of share growth from a year ago. Only Windows Phone showed a gain y/y in share up 1.6 points to about 3%. In the same time, Bada lost half a point, iOS lost 2.1 points, RIM lost 7.2, Symbian 11.4.

The result is shown in the graph below:

I also show a “before-and-after” pair of pie charts which show the difference in smartphone platform market share from the same quarter three years ago. Android went from 3% share to 67% while Symbian went from 41% to 4% and RIM went from 19% to 5%. iOS increased its share from 13% to 17%. Continue reading “American exceptionalism”

How many smartphones did Samsung ship in Q2?

50.2 million.

That’s the estimate from IDC. So why bother asking?

Because that is an estimate. Of the 104 million Android phones shipped in the quarter (itself an estimate from another, possibly different methodology), I could only account for 7 million actually reported. That figure comes from a close reading of an investor presentation from Sony. HTC does not report their shipment numbers. It stopped some time late last year. Neither does Motorola now that it’s a part of Google. Huawei is silent except for setting targets and ZTE published a press release citing IDC’s estimate of its own shipments.

But most glaring of all is the absence of any mention by Samsung of its performance. The company stopped reporting any data on either overall phone shipments or of smartphones within that total since Q3 2011. We may have been able to estimate Samsung if we had more competitor actuals, allowing us to back into a figure. But we don’t.[1]

Which leaves us with IDC’s estimate[2]. But the problem is that since the industry is growing so quickly it is very sensitive to assumptions. Consider how difficult it is for consensus estimates for Apple’s iPhone shipments to come near the actuals–and that’s for one quarter, and knowing all the previous quarters with precision. The absence of visibility into the assumptions made by market analysts (or their methods) should lower confidence in the results.

Consider that IDC specifies 50.2 million Samsung smartphones, implying an accuracy down to 100,000 units. Is this accuracy believable?

There is reason for doubt.

I start with the following graph:
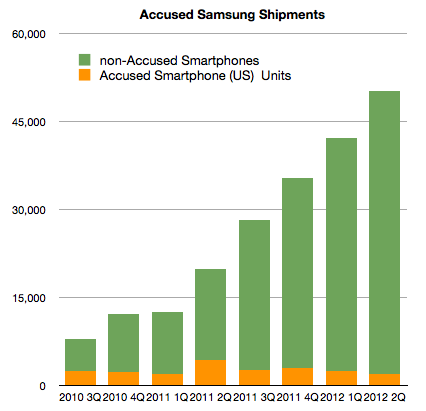
It shows the estimates for Samsung global shipments (latter four quarters are estimates without the benefit of company reports.) I separated the component of shipments that Samsung reported as part of its submission to the Samsung v. Apple trial in California. Note that this (orange) segment consists of most US smartphone shipments. It’s not all US Samsung shipments. It notably excludes the Note, the latest Nexus and the Galaxy SIII.

Continue reading “How many smartphones did Samsung ship in Q2?”

Samsung's basis of competition

Samsung has been selling smartphones for a relatively short time. Although the company sold Windows Mobile, Linux and PalmOS during the last decade, it did not gain significant volumes until it began selling Android phones in 2010 with strong operator support.

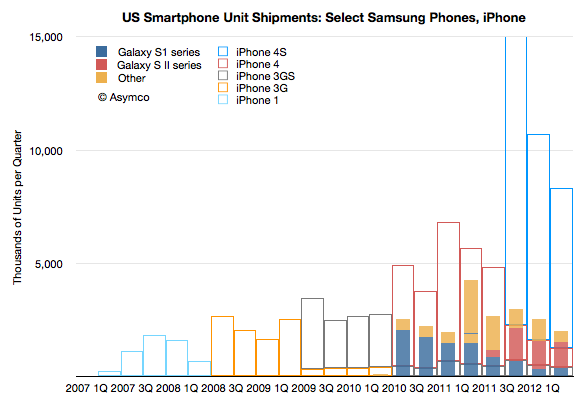
That support was substantial in the US. The company crashed the Android party in mid 2010 with its Galaxy brand. Trial evidence reveals that the sales level for Galaxy S1 series phones burst out of the gate taking Samsung from 90k units to 2.5 million units in one quarter.

The following graph shows the unit shipments recorded by Samsung for a set of US smartphones.

Note that the profile of sales volume shows a cyclicality with respect to product launches. Each new generation overlaps with previous generations and “fills in” while the older generation product tails off in sales. This is standard portfolio strategy. It also shows the cycle time of launches is approximately four quarters. As the S1 was four quarters old, the SII launched and the SIII follows after four quarters of SII.

What is surprising is Continue reading “Samsung's basis of competition”

Apple Store Operational Economics

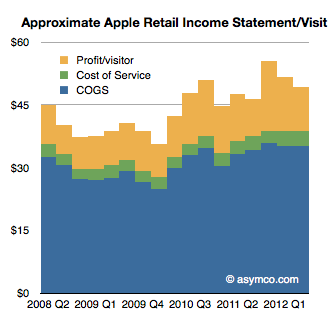
In a footnote to my last post on Apple Retail (The face and the brand) I used data on operating performance from Apple and an assumption about employee salaries (which turned out to be low) to estimate that about 7% of Apple store sales are spent on “cost of service” or the operational expenses, which consist of mostly employee salaries.

An updated view of this store income statement (on a per-visitor basis) is shown below:

To summarize the logic, Continue reading “Apple Store Operational Economics”

5by5 | The Critical Path #49: Fly me to the Moon

Horace takes another look at the aviation industry and asks whatever happened to air taxis. Then we go back to the manufacturing miracle of WWII in order to ask what might be the limits to growth. That helps us describe the “top down” opportunity for iOS and mobile computing in general looking at the overall mobile phone market. Finally Dan asks what are the qualifications needed for an analyst to perform wide-ranging reviews of industries.

via 5by5 | The Critical Path #49: Fly me to the Moon.

See also: Headroom (tweet).

Exclusive interview with Asymco's Horace Dediu | The Tech Block

Horace, you spent nearly a decade at Nokia, where you worked as a business development manager and industry analyst. Did you foresee their current, increasingly dire situation?

I did not see an explicit downfall. I anticipated difficult times ahead and a deep crisis. My view of what would happen was published as my first Asymco post.

What led you to start Asymco?

I started a consulting company which I hoped would generate leads through a blog. The blog became far more exciting than consulting and it became my primary focus after about one year. I had no ambition to write for a living or to be a “blogger”. I did not anticipate there would be any interest on the topic I wrote [about] beyond a handful of people. In that regard, things played out as they do at most start-ups: what you end up doing is not anywhere near the target you aimed at.

Apple’s clearly one of your favorite topics. What about the company appeals to you?

Business education is predicated on storytelling, also known as the case method. Business management is not a discipline that has “axioms” defining basic truths, or if it does, they change frequently. Therefore business education (i.e. the MBA) is the equivalent of people teaching each other by telling stories around a campfire. The best stories get repeated more often and are better ‘teaching tools’. So it is with Apple. It’s a great medium for story telling because people can see the stories unfolding in real time or at least within their lifetimes. They are not about a distant past or an abstract industry. There is also a lot of passion around the brand, both positive and negative and so it leads to more attention.

Read more here: Exclusive interview with Asymco’s Horace Dediu | The Tech Block.

Measuring iOS as a gaming platform

At this year’s WWDC Apple offered an update on Game Center accounts. The data we have so far is shown in the following graph.

Before being acquired, another network, OpenFeint, announced 180 million iOS accounts in October 2011. Another figure to consider is the 40 million subscribers to Xbox Live (out of 66 million Xbox users). This subscriber base is paying for a service (about $1 billion per year) so it’s not the same as the free Game Center model.

Rather than being a revenue source, Game Center is designed to engage users and to capture usage information. It also lets us gauge gaming “consumption” on iOS devices. That itself allows us to contemplate it as a gaming platform vis-à-vis alternate platforms.

To consider the figure as a proxy of penetration and engagement, the graphic below shows cumulative sales of gaming devices.[1] Continue reading “Measuring iOS as a gaming platform”

How many iPhone “5''s will be sold?

Phil Schiller stated (under oath) that when assessing sales for a new model of the iPhone, Apple used an easy shorthand:

Each new generation sold approximately equal to all previous generations combined.

That’s a helpful gauge. Did it hold and will it continue to hold?

In order to test this rule of thumb we need to know generational sales. Although we know overall unit sales for a given quarter, since Apple has been selling several versions simultaneously, we need to make some guesses about the ratio of generations in the mix. My guess is about 10% for 3G vs. 90% 3GS and 5% 3GS vs. 10% 4 vs. 85% 4S. That results in the following pattern:

The cumulative totals for these generations can then be generated and they appear as follows: Continue reading “How many iPhone “5''s will be sold?”

The biggest loser

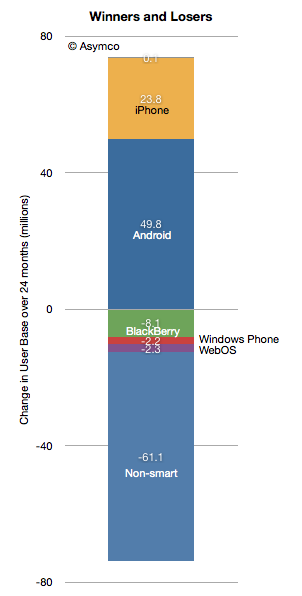
According to data from comScore, in the past 24 months 50 million Americans became Android phone users. In the same time frame Apple added 24 million iPhone users. As I mentioned in my Asymmetric Competition post, it would be unwise to consider this data in isolation. Consider the following graph showing the net change in users in the US.

Android and iPhone grew mostly at the expense of non-smart users. The BlackBerry lost 8.1 million users and all the others only lost about 4.5 million.

With penetration at 50% it’s still impressive that there is so little “churn” between platforms. In fact, measuring churn as the net platform user loss as a percent of all smartphone users, we get something less than 1% per month.

The smartphone competition is still primarily with non-consumption.

That will change at some point when smartphone penetration (shown below) will begin to saturate. Continue reading “The biggest loser”