
Thanks to @jtk0621 via twitter I was able to obtain a quarterly view into Samsung’s SG&A expenditures by cost category.
The value of this data is in being able to understand why Samsung SG&A as a percent of sales remains fairly constant. To recap, the discrepancy with Samsung’s SG&A is that it has grown in proportion to rapidly rising sales. Normally, when sales grow, SG&A grows but when sales grow very rapidly, SG&A grows a bit more slowly since it’s primarily a function of headcount and hiring is necessarily organic and hence slower as a process.
The contrast is shown in the following comparison between Apple’s SG&A and Samsung’s SG&A as a percent of sales. [For more detail on Samsung revenue composition see: The Cost of Selling Galaxies].
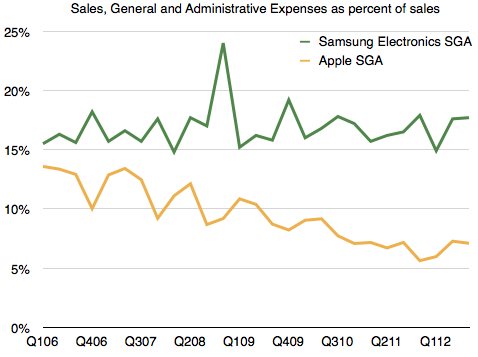
Apple’s SG&A has declined as a percent of sales, as one would expect, but Samsung’s hasn’t.
I have hypothesized that the reason for this might be in the practice of “outsourcing” many marketing functions. As Samsung expands promotional efforts, it does so partially by hiring people but even more so by farming out a lot more work. In this way, if and when sales subside, it can pare costs. This practice ensures that it’s not exposed to a huge cost structure that is hard to control. The downside to this approach might be obtaining “quality” marketing as oversight is still depending on inside teams who still have limited resources.
To test this hypothesis, I looked at the types of costs it reports and divided them into two categories:
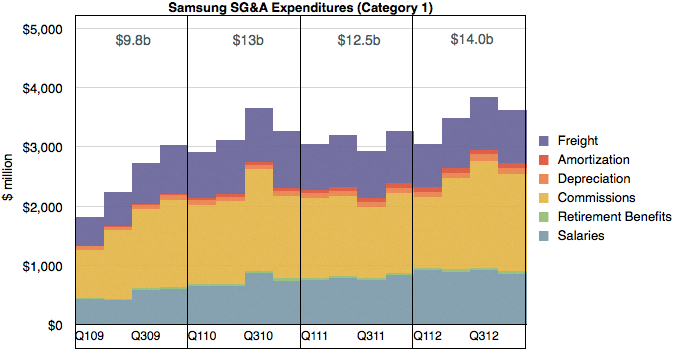
Category 1 are what might be considered “internal” costs which are in function of employees or operations. These costs are:
- Salaries
- Retirement Benefits
- Commissions
- Depreciation
- Amortization
- Freight
I graphed these costs over time below:
Category 2 costs are those which can be “outsourced” and are in function of budget items. These are:
- Advertising
- Sales Promotion/Marketing
- After Service Expense
- Public Relations
- Other
I graphed Category 2 costs below:
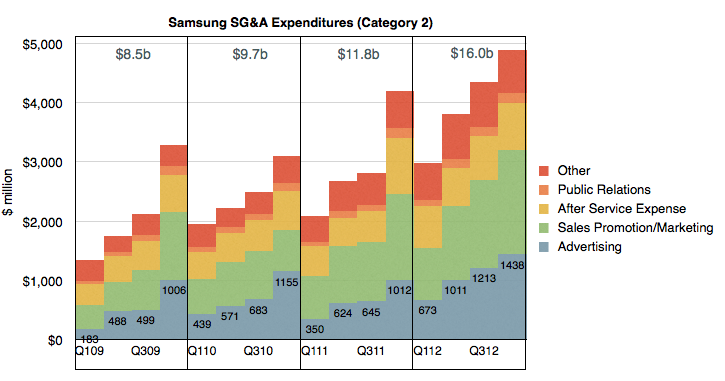
In both cases I created year-sized buckets summarizing these expenditure categories.
It becomes apparent at first glance that through the period shown (2009 through 2012) Category 2 costs grew much more rapidly than Category 1. In 2009 Category 2 were less than 1 but the order was reversed in 2012. On a yearly basis Category 2 nearly doubled while Category 1 grew by about 40%.
When seen in this context, the hypothesis is proven. The growth in Samsung SG&A has been driven by a vast expansion of primarily Advertising and Sales Promotions.
It’s hard to get an appreciation of the scale involved due to the lack of comparable SG&A category reporting from other companies. What we do have however is that US companies typically report their advertising spending on a yearly basis.
So taking only the Advertising figure from Samsung Electronics, we can get the following comparison with Apple, HP, Dell, Microsoft and Coca Cola.
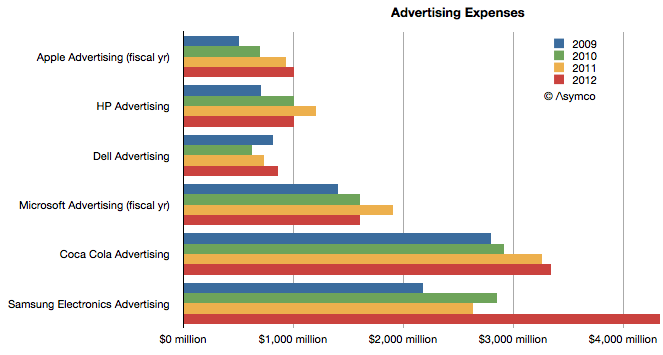
In this context we can see that while both Apple and Samsung grew their advertising almost at the same rate, doubling their budgets during the last four years, Samsung Electronics has a far higher ad budget. More than four times higher, actually.
Regarding Sales Promotions however, the comparison is far harder to make. I haven’t any way to guess how much Apple spends relative to the $5.3 billion Samsung spent.
Discover more from Asymco
Subscribe to get the latest posts sent to your email.