
When the iPhone 4S launched, one million units were pre-ordered and 4 million units were sold during its opening weekend. That made the daily rate during the 4S weekend 1.3 million units/day or one third faster than the pre-order rate of 1 million units/day.
When the iPhone 5 launched, 2 million were pre-ordered and “over” 5 million were sold during during the opening weekend. That made the daily rate during the launch weekend about 1.7 million which was about 15% slower than the pre-order rate. However, a few months later the 5 launched in China setting an opening rate of 2 million in three days or about 666k/day. Adding China’s rate to the Rest of World rate yields about 2.4 million/day or about 20% faster than the pre-order rate.
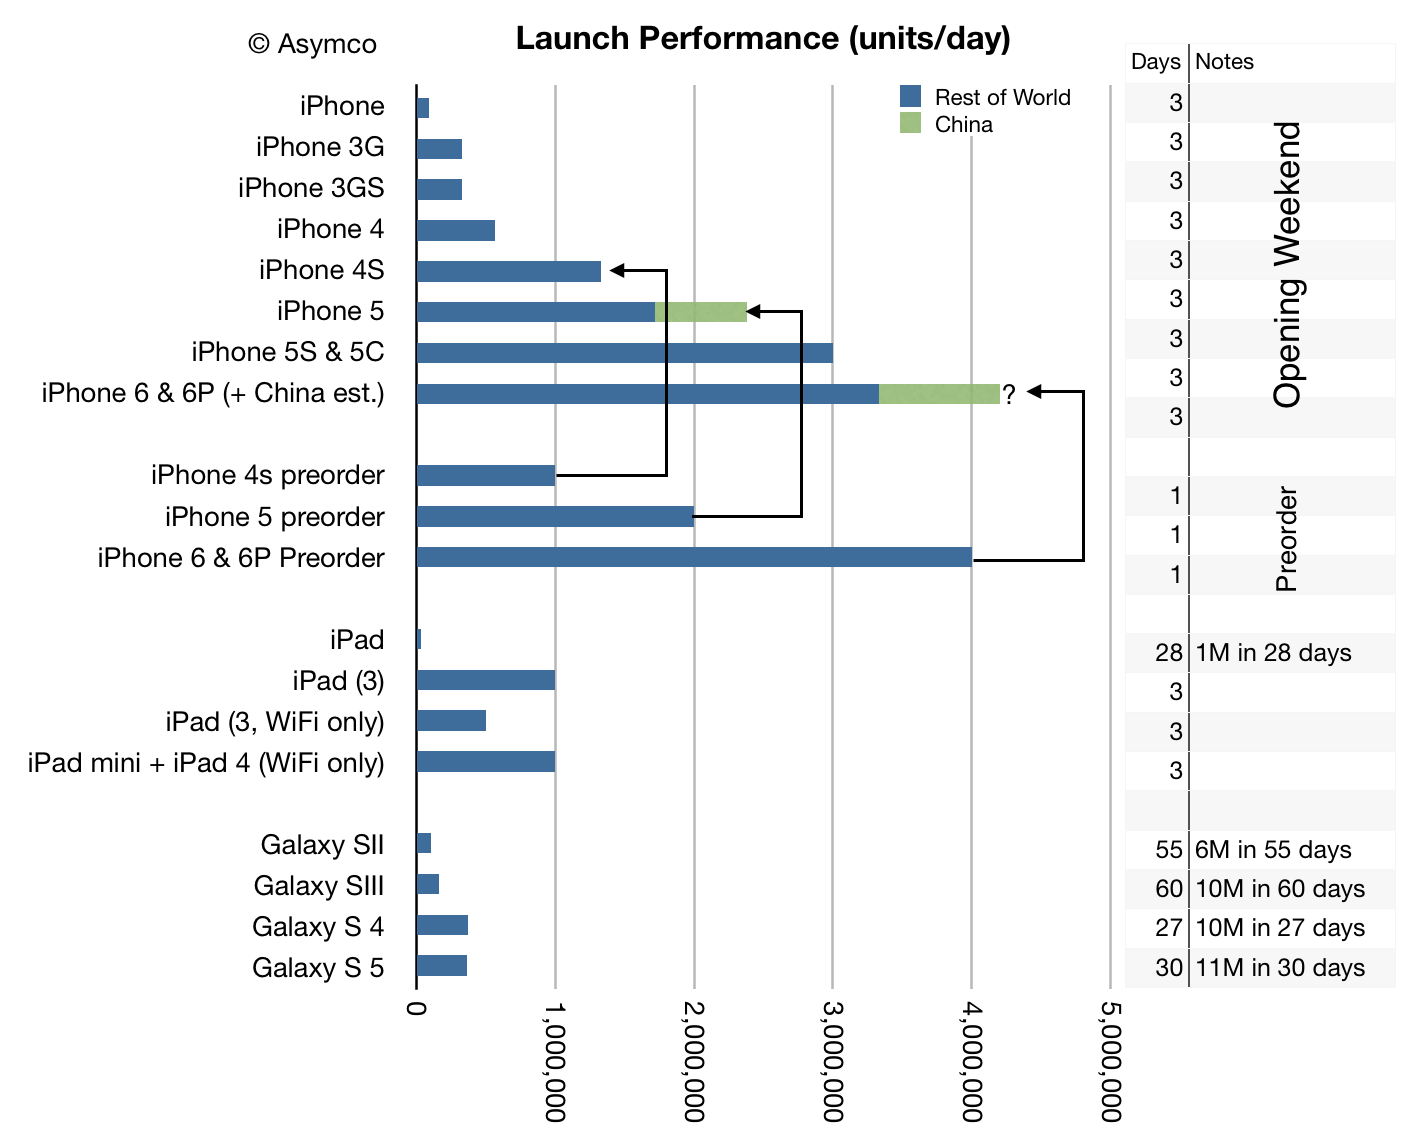
When the iPhone 6/6Plus launched, 4 million were pre-ordered and 10 million were sold during the opening weekend. That made a daily rate during the launch weekend about 3.3 million, again lower than the 4 million/day in pre-orders. However, just like the 5, the 6 launch excluded China. If we assume that a China launch would have run 30% faster than the 5 launch1 then my estimate of launch performance for the iPhone range is shown in the graph below:
I included in the graph the various other launch volume data we have available.
I also included lines showing how pre-order volumes relate to weekend values for the products where we know both.
It therefore does not seem improbable that had China been available (and at the time when it will be) the iPhone launch weekend rate for the 6/6Plus combo would have been about 4 million/day. A rate consistent with the history for the product.
- Considering that this year China distribution includes China Mobile a 30% increase from two years ago is, in my opinion, conservative [↩]
Discover more from Asymco
Subscribe to get the latest posts sent to your email.