
Apple’s Net Sales grew at the rate of 30% in the last quarter. Earnings per share grew at 47%. Both of these figures are the highest since 2012.
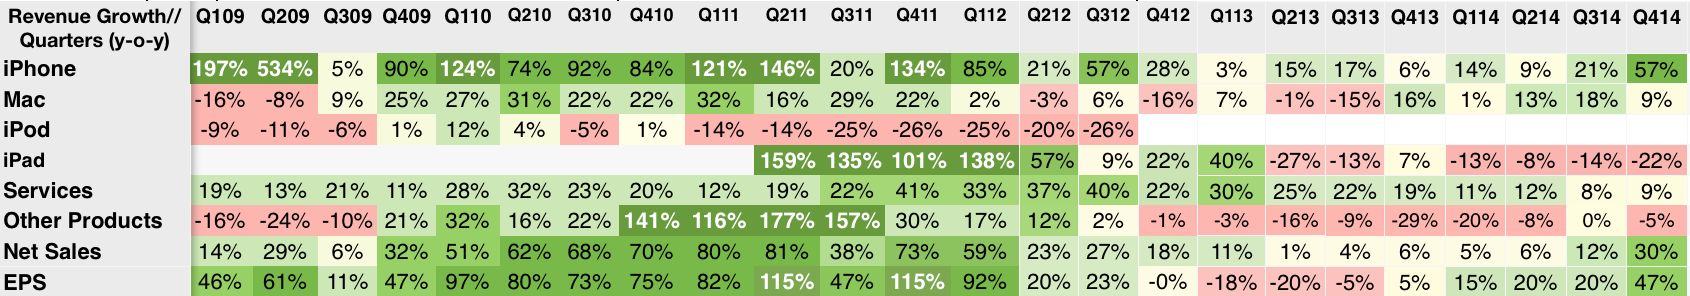
It should be noted that although the rate of growth is extraordinarily high, the company never actually stopped growing in the past three years. As the table above shows, net sales has always had positive growth.
Compared with the fourth calendar quarter of 2011, Apple’s sales are 61% higher and earnings per share are 54% share.1
This degree of growth at this stage in the history of the markets it participates in is a revelation.
Consider:
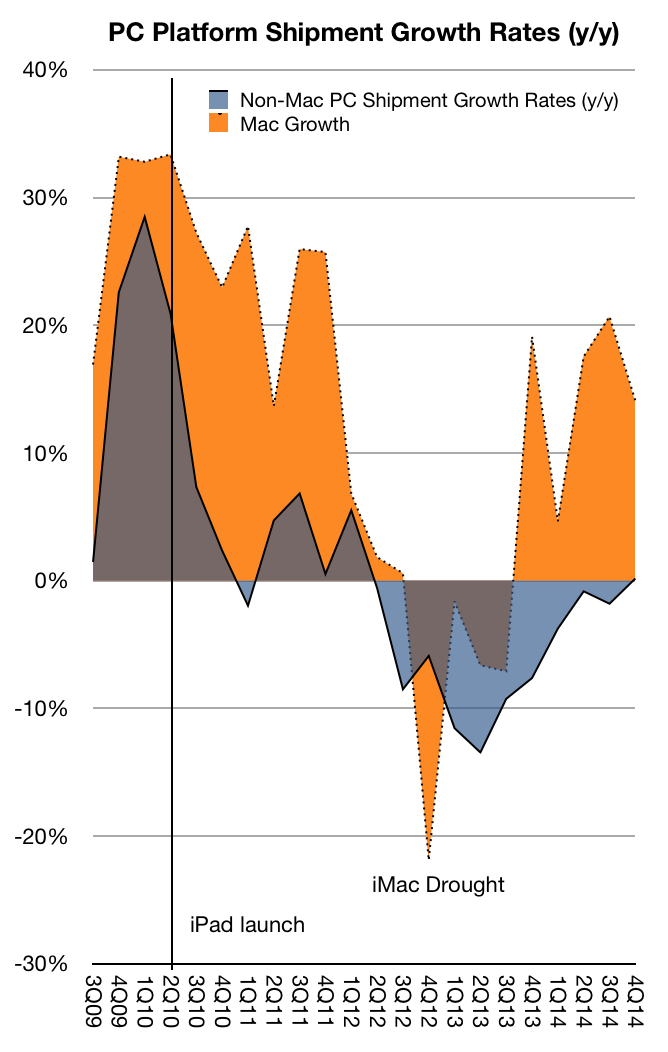
- The PC market is more than 30 years old. In this mature market the Mac has been outgrowing the Windows platform for 34 out of the last 35 quarters.
- The iPhone was announced eight years ago and it still managed to grow at the rate of 57%.
- The market shares of its Mac, iPhone and iPad products are all remarkable only for their paucity.
- The pricing of all their products is more than double the median for their categories.
- Regardless of extreme growth, pricing power, headroom and, most importantly, customer loyalty, the company’s prospects are seen as dismal in contrast to its underperforming peers.2
- Such is the plight of the anomalous.
- Some of the expansion in earnings per share is due to the willingness of shareholders to sell their shares to Apple. 10% of the shares around in 2011 have thus disappeared. [↩]
- As measured by P/E or FCF/EV ratios vs. direct rivals, technology companies or the S&P 500. [↩]
Discover more from Asymco
Subscribe to get the latest posts sent to your email.