
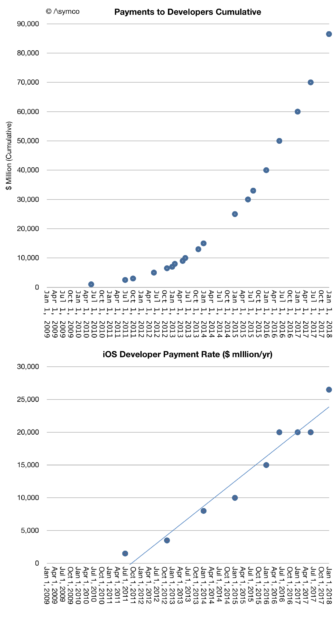
In its latest update on the App Store Apple reported that iOS developers earned $26.5 billion in 2017. A year ago the figure was $20 billion. The growth rate is then about 33%. The cumulative payments to developers can be calculated as $86.5 billion. This amount was generated in a span of less than 10 years, with the first billion paid by June 2010.
The following graph shows the history of cumulative payments and the corresponding payment rate (in $/yr.)
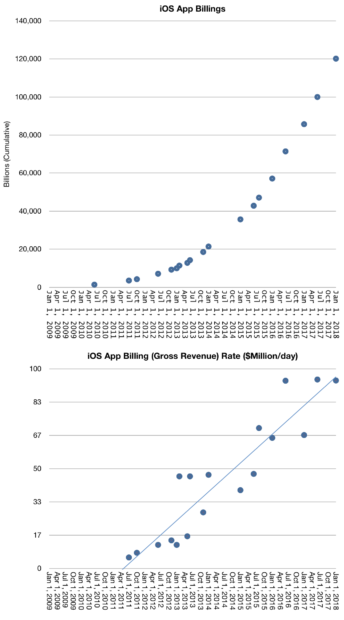
Note that this represents the payment to developers, not the spending by the customer. Apple keeps about 30% of the revenue. The total spending on the App Store is then about 43% higher.1. The equivalent figures for spending on the App Store are shown below.
A few observations:
- Developer payment rate is now above $25 billion/yr. I’ve been notified via Twitter that this is higher than the revenue of McDonald’s Corporation in 2016.
- During this year iOS users will be spending about $100 million per day for Apps. This was Google’s AdWords revenue rate in 2012.
- The spending on App Store has been rising steadily, adding about $5 billion/yr since mid 2011.
- Apps are the biggest component of Apple services and helped that segment gross over $57 billion in 2017, passing Fortune 100 level (net of developer payments).
I’ve made comparisons before with the app business being bigger than the film industry (and much bigger than the music industry.) This was considering Android revenues and iOS combined as “app revenues”.
As of this year the App Store alone will overtake Global Box Office revenues.
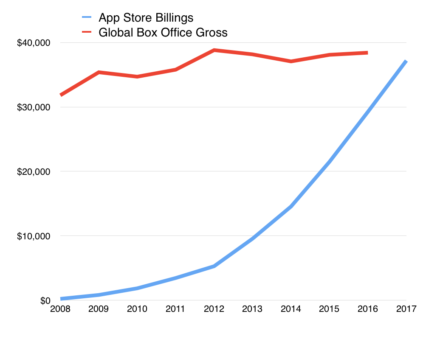
Of course this is only an observation of the scale of App Store rather than a judgement of the benefit obtained from either medium or the substitutability of one for the other.2 The reason scale should be noted is that the App Store, and Apple services overall, is becoming one of the largest enterprises in the world. Even more importantly, it should be noted for its rate of growth.
Even when considering this, one should keep in mind that the figures of revenue and payments to developers are only a small fraction of the overall app economy. Apps sold to end users are a subset of all apps on the App Store. There are not only free apps but also many apps which are front-ends to complex services which are monetized in various indirect ways.
Facebook, Twitter, Linkedin, Tencent, YouTube, Pandora, Netflix, Google, Baidu, Instagram, Amazon, eBay, JD.com, Alibaba, Expedia, Tripadvisor, Salesforce, Uber, AirBnB and hundreds of others are all “free” apps enabling hundreds of billions of dollars of interaction none of which are captured in the App Store revenue data. The vast majority of activity for the top commerce, communications and media properties are now coming through mobile devices.
By weight of users and their propensity to engage, iOS enables about 50% to 60% of mobile economic activity.
Based on assumptions of revenue rates for mobile services and iOS share of engagement, my estimate of the economic activity on iOS for 2017 is about $180 billion. Including hardware sales, the iOS economy cleared about $380 billion in revenues 2017.
Additional assumptions around growth rates suggest that iOS economy will achieve the half trillion revenue rate in 2019. Valuing this, especially as a part of Apple’s intrinsic value, is a challenge but it’s probably worth doing. There are implications in the robustness or sustainability of the underlying business.
- During the last year some types of app subscriptions have been priced by Apple at 15% of gross so I adjusted the payment rate to 72% for 2017 [↩]
- The substitutability of apps for movies is not to be discounted either. The analysis should be based on understanding the jobs the media are hired to do. [↩]