
The first number that Tim Cook mentioned in the fourth quarter investor conference call was the number of active Apple devices. The 1.3 billion monthly active devices is the most important measure of the health of Apple’s business. It’s the primary way the company chooses to measure itself and it’s the best instrument available to understand the company’s strategy.
This is only the second time this number was revealed. The previous figure, given in January 2016, was 1 billion active devices. Thus, while Apple sold 586,744,000 devices1 the number of active devices increased by 300,000,000. While the number of units sold is frequently updated and attracts a lot of attention, the number of units active is very infrequently updated and attracts little attention. Yet the number of active devices speaks of the future of the company and should be carefully scrutinized while the number of devices sold speaks of the past and should be cursorily glanced at.
Dr. Edward Deming once said that the numbers that best define a company are two factors that do not appear on any financial statement. These factors are the value of a satisfied customer and the value of a dissatisfied customer. These factors must be multiplied by every other number in a financial statement in order to assess the prospects of the business. A high satisfaction leads to repeat purchases and referrals, growing the business; while a low satisfaction leads to ending relationships and a repulsion of potential new customers.
These numbers determine everything about the future and nobody quite knows what they are.
It’s tempting to suppose that, by asking, you can find out if customers are satisfied. Certainly the company cites these answers to the question of satisfaction and it’s partially useful to have some data. But customers are people and people are social beings. They are flawed in that they want to be liked and will use their powers of deduction to determine whether what they say will lead to their being liked more. Thus they will say things which they judge the listener will want to hear.
This auto-suggestion is especially likely when the answer (satisfaction) is so difficult to ascertain and the feeling is so fleeting.
You can’t rely on surveys alone to know if people like your product. You have to base that number on what they do.
This is where the active device data comes in.
A liked product will be used and a well-liked product will be used more. Usage is valuable not just in its intensity but also in its duration. When you see activity of a device it’s always a good sign if that is both frequent and long-lasting.
The following graph shows the history of cumulative devices sold by Apple since mid-2007, when the iPhone was launched. That total is now 2.05 billion devices. I have added early estimates on the number of active devices (in red) based on assumptions about product life-span. I added the company’s own reported figures since then.
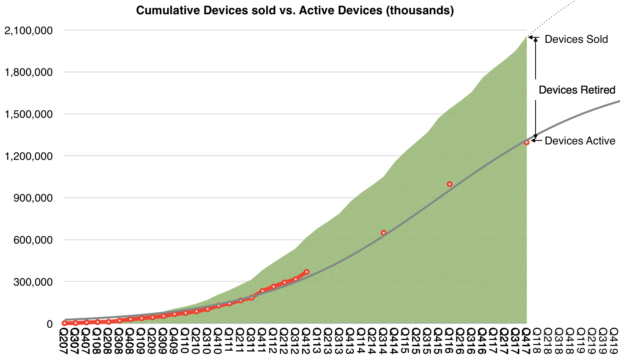
I then tried to paint a continuous curve for this active number using a logistic function which assumes a diffusion into a population of addressable users, shown as the grey line above. The logistic curve is a good tool because it has a solid theoretical foundation in social behaviors.
The formula for this line is S÷(1+EXP(−1×(t−o)÷g)) where S is the point of saturation or maximum population size, t is the period or count of quarters (1 for Q1 2007 and 2 for Q2 2007, etc), o is the offset to 50% or the point of inflection, in quarters, and g is the growth factor.
The S-curve above corresponds to S=1.8 billion, o=35 and g=8.
I chose these parameters because they best fit the data. It does not mean the reality will be precisely this but this is the best guess so far. It implies that there will be about 1.8 billion active devices sometime close to 2022 and tells us how we get there. This can and will change but for now this is the best guess using a theory that has worked in similar circumstances.
Working backwards from this active base estimate, we have predictive power on units sold, and even on revenues. However this is not the whole story. It’s not even the main story. What matters is what it tells us of the relationship between past behavior (purchases) and future behavior (use, referral, repeat purchase). This is hinted at by the ratio between purchases and active devices. In other words, the ratio between cumulative units and active units tells us whether the products are used and for how long. Having a continuous estimate of active uses allows for a reliable measure of satisfaction.
The following graph shows this estimate.
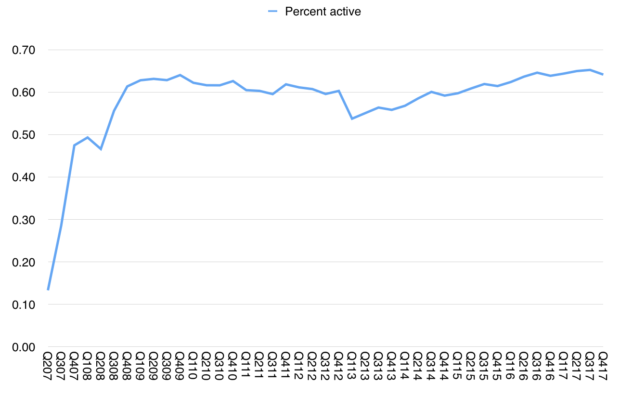
Note that the ratio remains remarkably constant. It’s currently about 64%. It’s so constant that perhaps we can invent a rule of thumb which says that two out of every three devices ever sold by Apple is still in use. And that this rule is always true.
This begins to be interesting.
The staying power and predictability of the business2 comes from a guarantee that activity is rigidly tied to purchase.
This speaks more than any satisfaction survey. It’s a measure of actions based on interaction rather than words based on human frailty.
There is no better number available to predict Apple’s business.
- This is an estimate that includes Macs, iPhones, iPads and Apple Watch but does not include Apple TV or accessories such as AirPods. [↩]
- i.e. Free cash flow [↩]
Discover more from Asymco
Subscribe to get the latest posts sent to your email.