
The EV car market is booming. The graph below shows the global market for plug-in electric cars (plug-in hybrid (PHEV) and battery (BEV)–BEV are about 70% of total). The data is split between 2019 and 2020 with further distinction between the main regions.
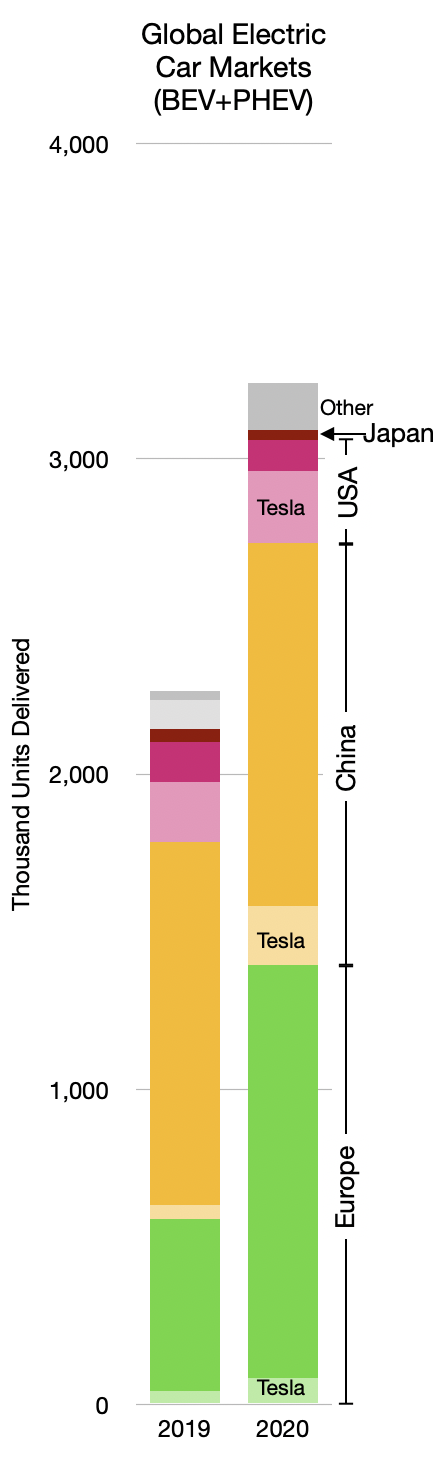
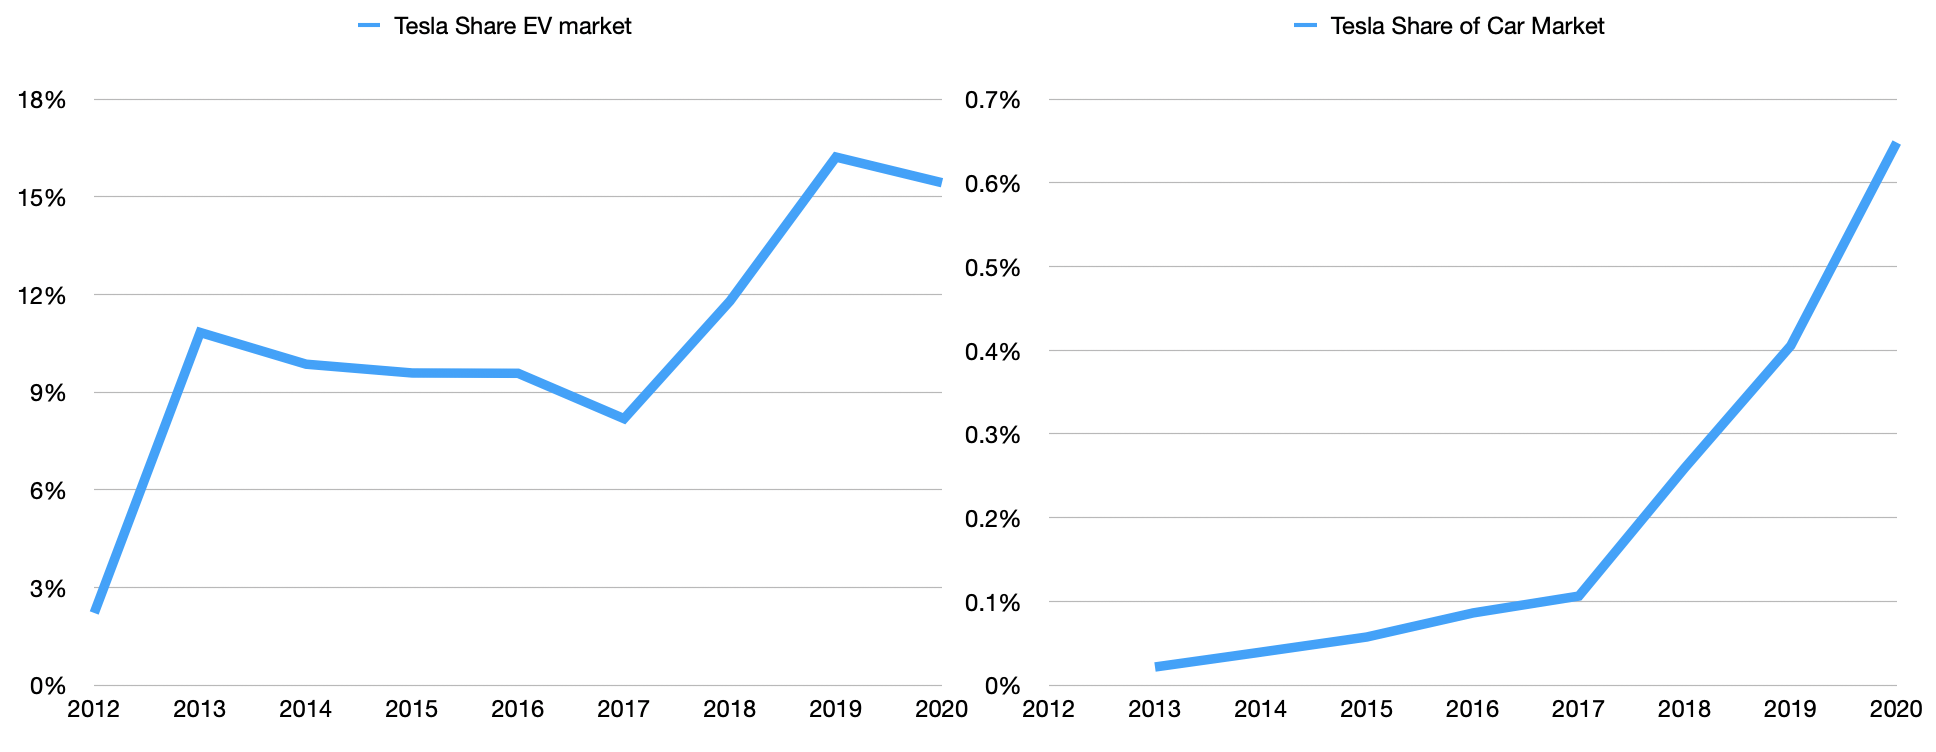
There is an additional detail in the delineation of Tesla’s shipments into these regional markets. To that point Tesla’s market share of all EV cars has remained roughly equal from 2019 to 2020.
The big story of 2020 was the growth of European EV shipments. Those who follow the market know that new EU penalties for CO2 emissions have come into effect, causing much of this increase. Indeed, previous surges in the US and China have also been driven by new incentives and/or disincentives.
As an aside, it should be noted the absence of Japan from this EV story. It’s quite a shock, really. Japan is responsible for a large percent of all cars sold through its national heroes Toyota, Nissan, Honda, Mitsubishi (and Subaru, Suzuki, Mazda, Isuzu) and has been a driving force for innovation. The absence of a local market for EVs is a glaring indicator of lack of industrial policy. Unlike the US, Japan does not even have an oil industry, importing all its supply (while the US is a net exporter.) Yet the US produces and consumes far more EVs than Japan. This should give pause. One wonders what would happen if Japan followed Europe in providing incentives for EVs in the “JDM” market.
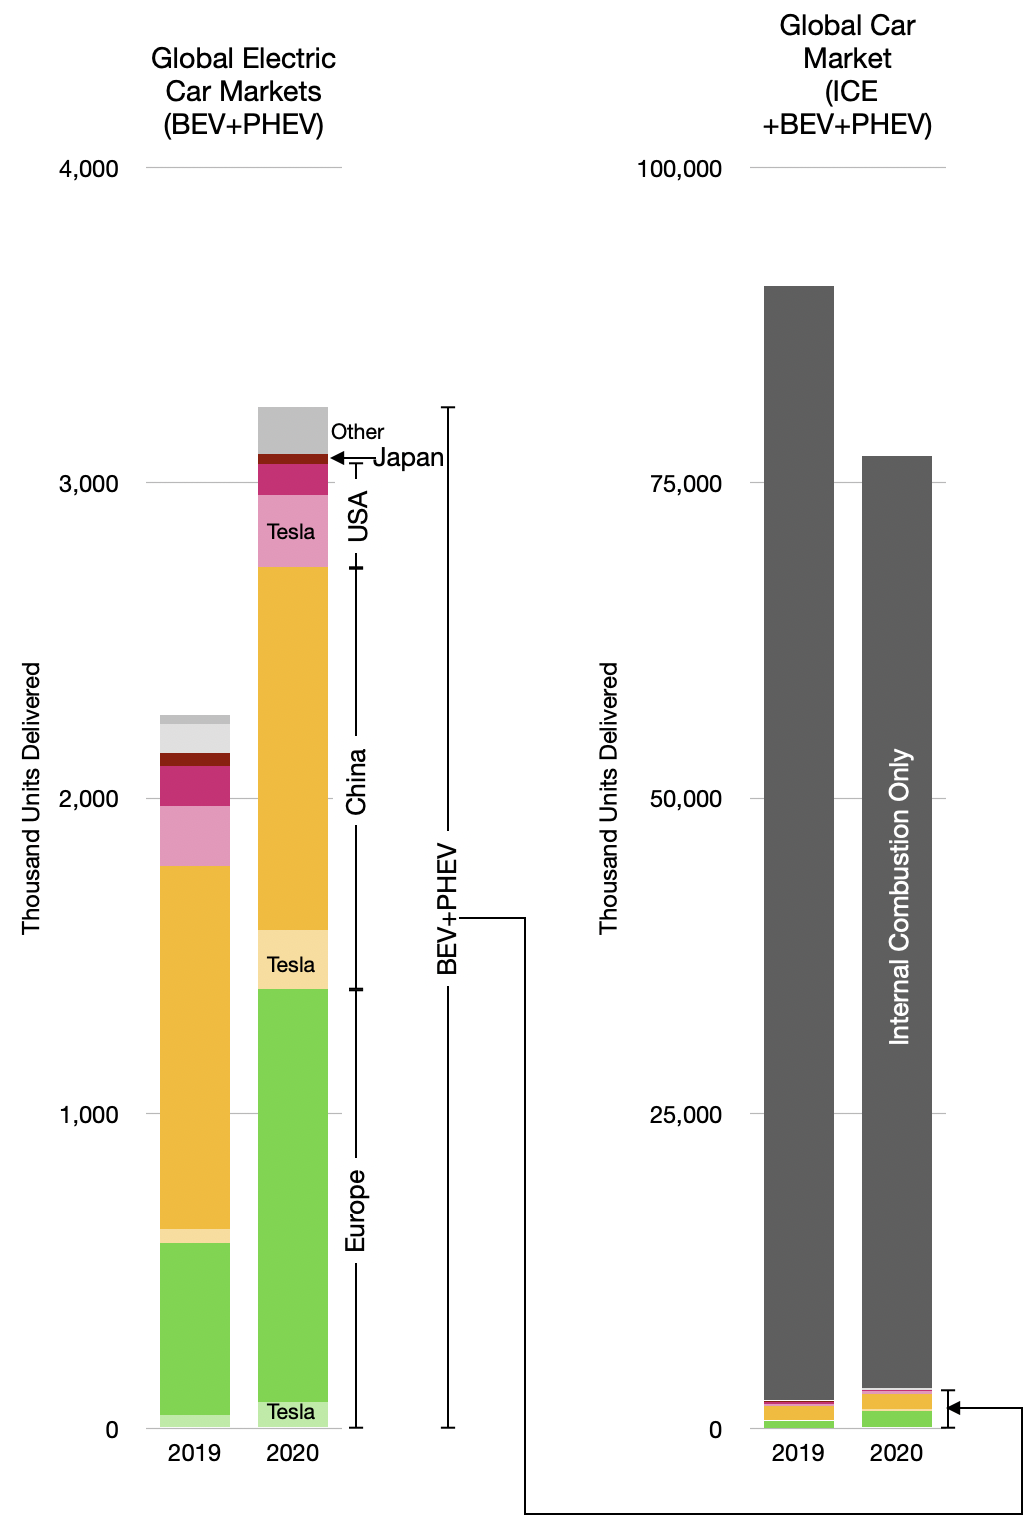
Japan and “Other” countries aside, there was growth. But much remains to be done. The overall industry is far larger, as shown in the following graph.
Nevertheless, optimism abounds. With an increase in market capitalization of about 648%, Tesla is now the most valuable automaker in the world.
Tesla, the champion EV maker has taken 17 years to reach 0.65% market share.
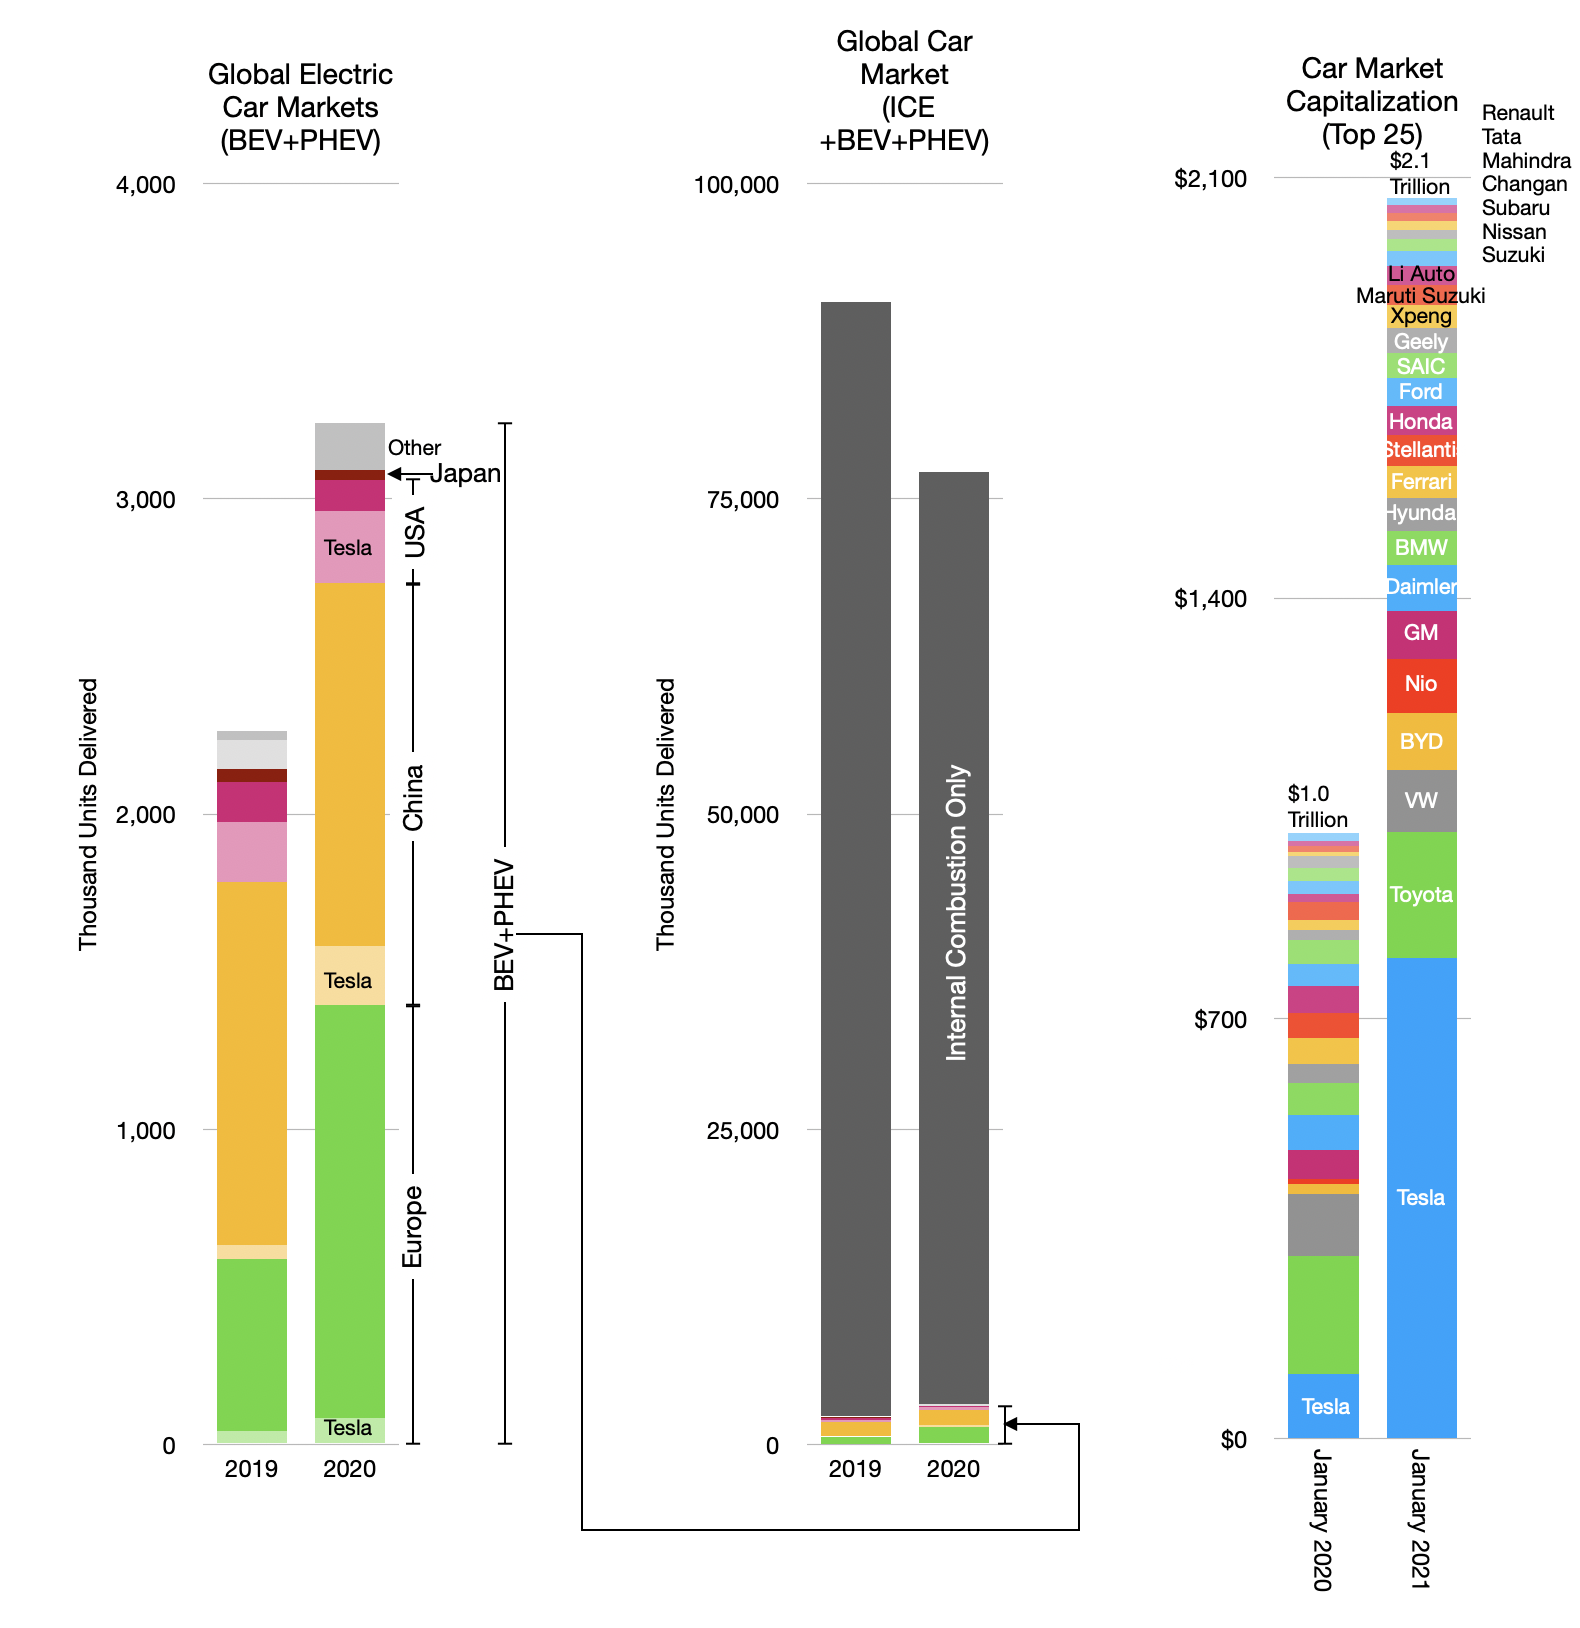
Actually, as the graph shows above, Tesla is now almost as valuable as the entire auto industry was a year earlier. But the rest of the industry did not collapse. The top 24 companies (i.e. apart from Tesla) increased their market capitalization from $901 billion to $1266 billion during 2020. That’s a 40% increase during a year when sales fell by 15%. Quite an achievement.
Overall the market capitalization of the top 25 automakers more than doubled from $1.0 to $2.1 trillion. This begs many questions, mainly, how would such profits ever be generated.
To put a finer point on it, if we divide the market capitalization by units produced we get a figure of value that allows a historic perspective.
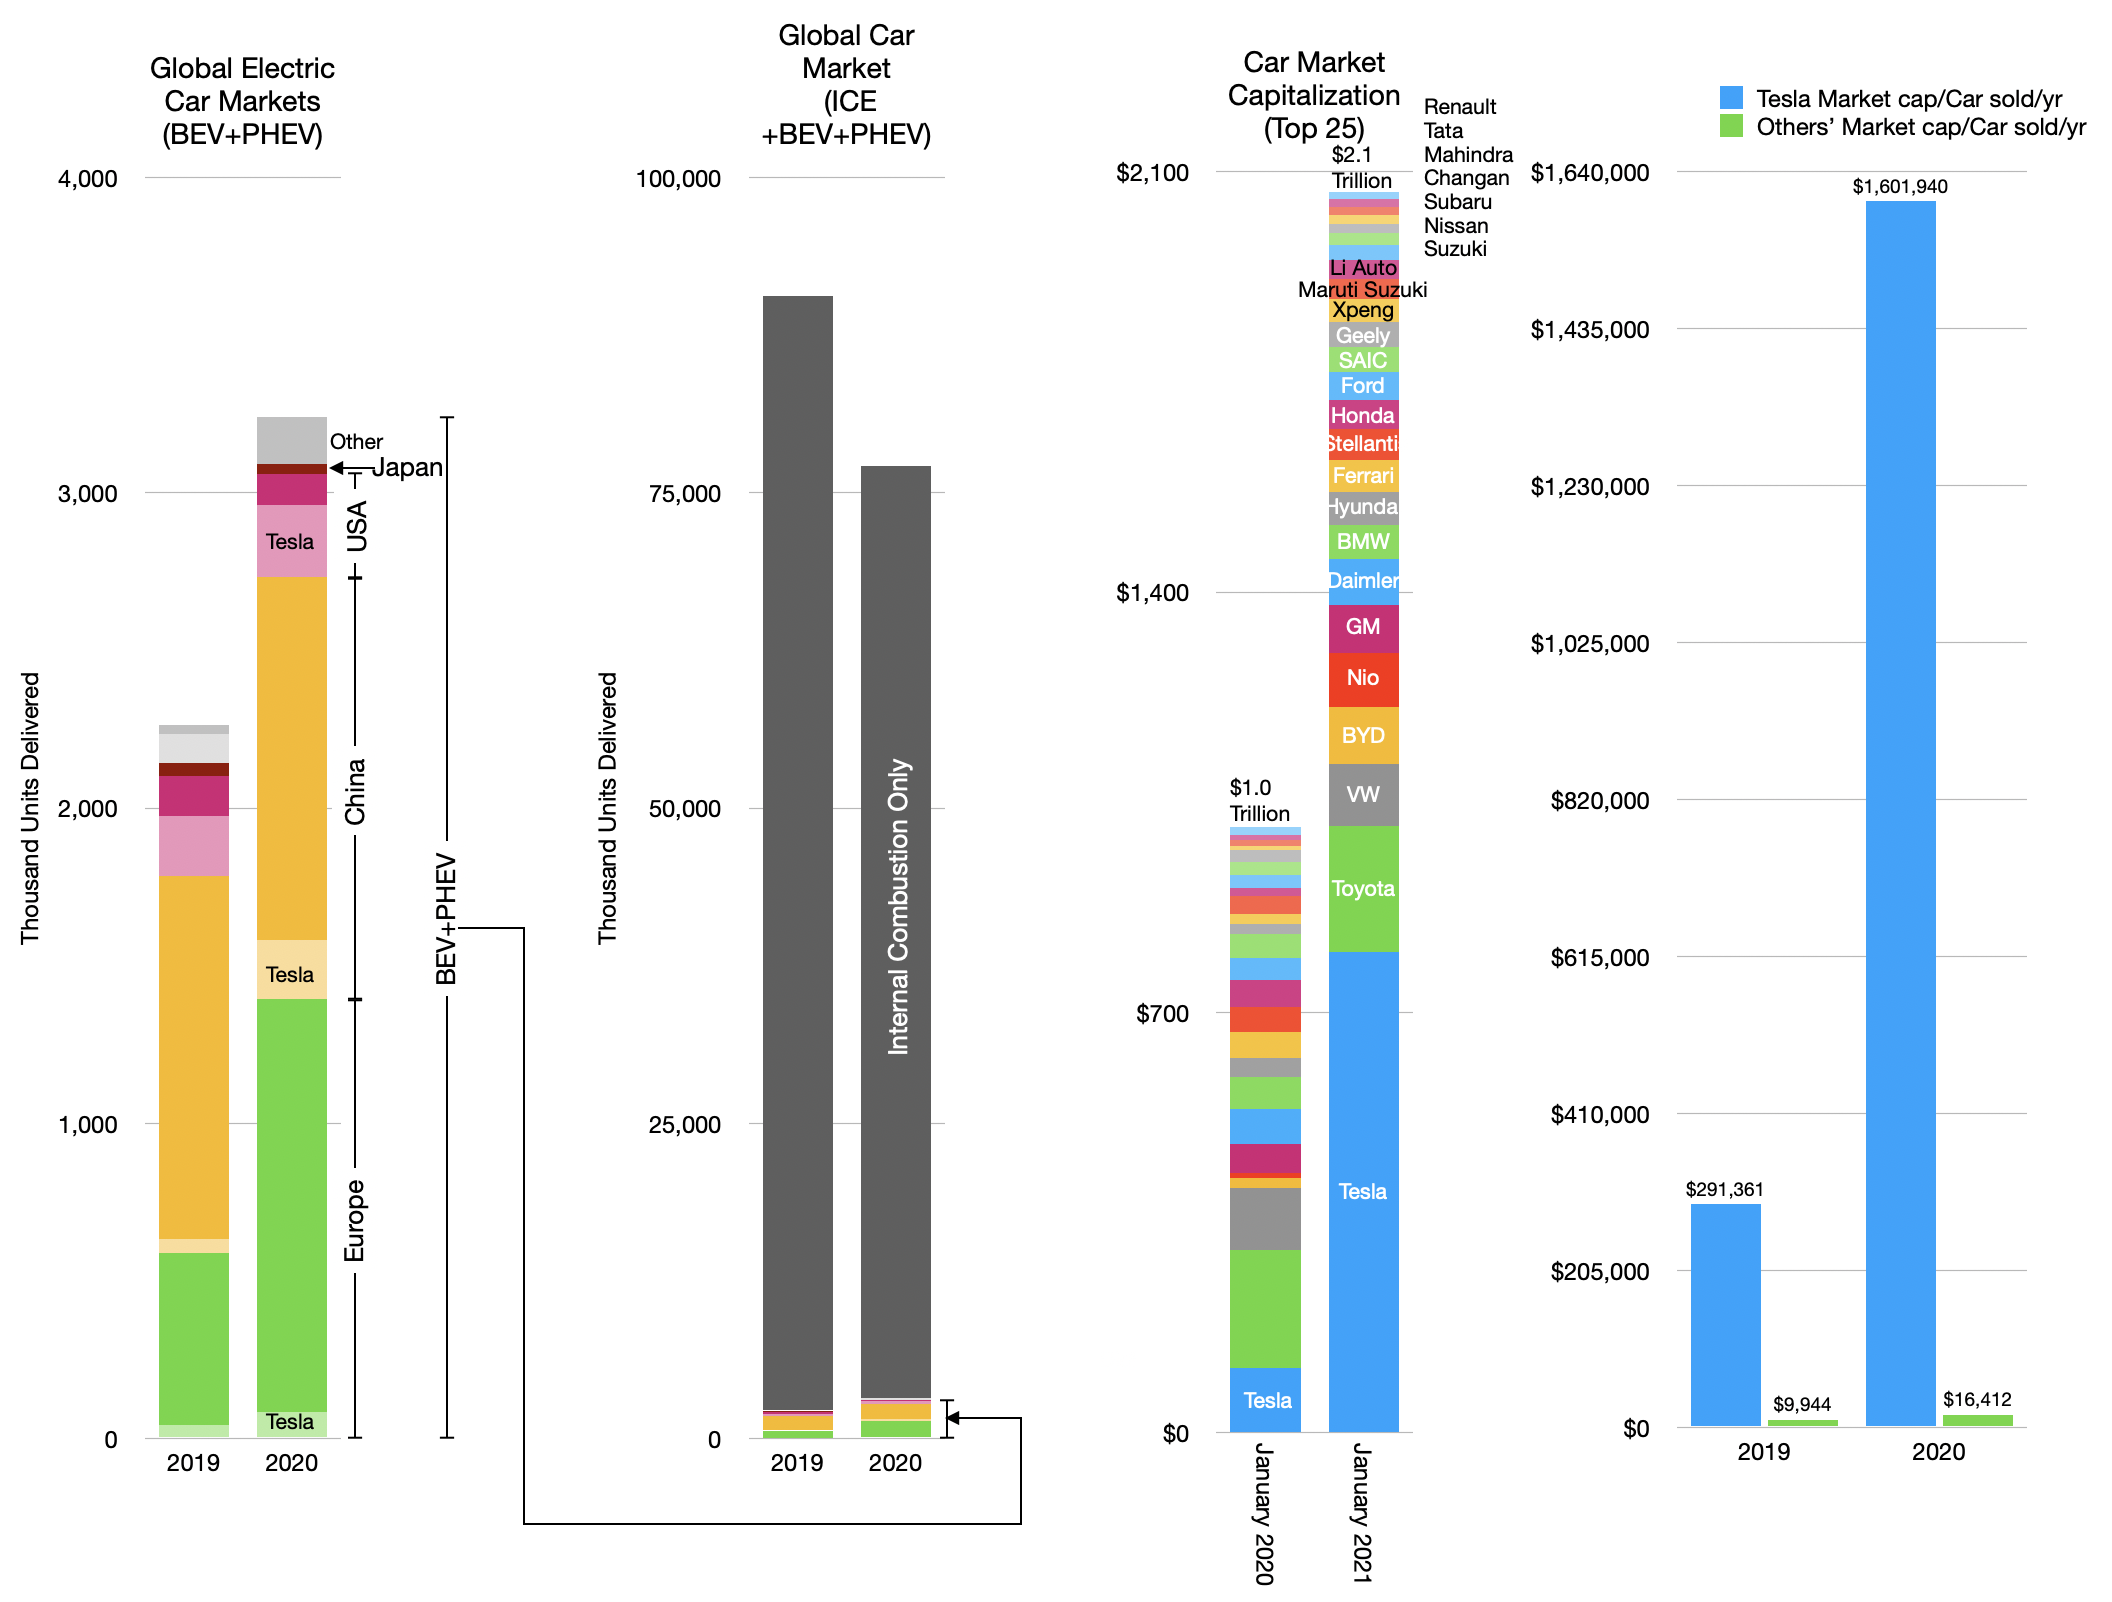
Historically car companies were valued at $8,000/yr. 2019’s value was about $10,000 which makes sense given some inflation. But the drop in volumes coupled to increase in valuation brought the ex-Tesla cap/unit to an eye-watering $16,400, a 64% increase in one year.
Tesla’s valuation is on a different level. It went from $291,361 to over $1.6 million/car sold. Roughly this is 100x rest of industry.
But if we continue to pull the thread there’s yet another story to consider. The car industry (i.e. making and selling and servicing cars) is not the only way to deliver “miles” to citizens. There are multiple “modes” and services that deliver transportation.
There are also the ride hailing and micromobility which are positioned on different “jobs-to-be-done” than cars. The market capitalizations of ride hailing and micromobility are shown below
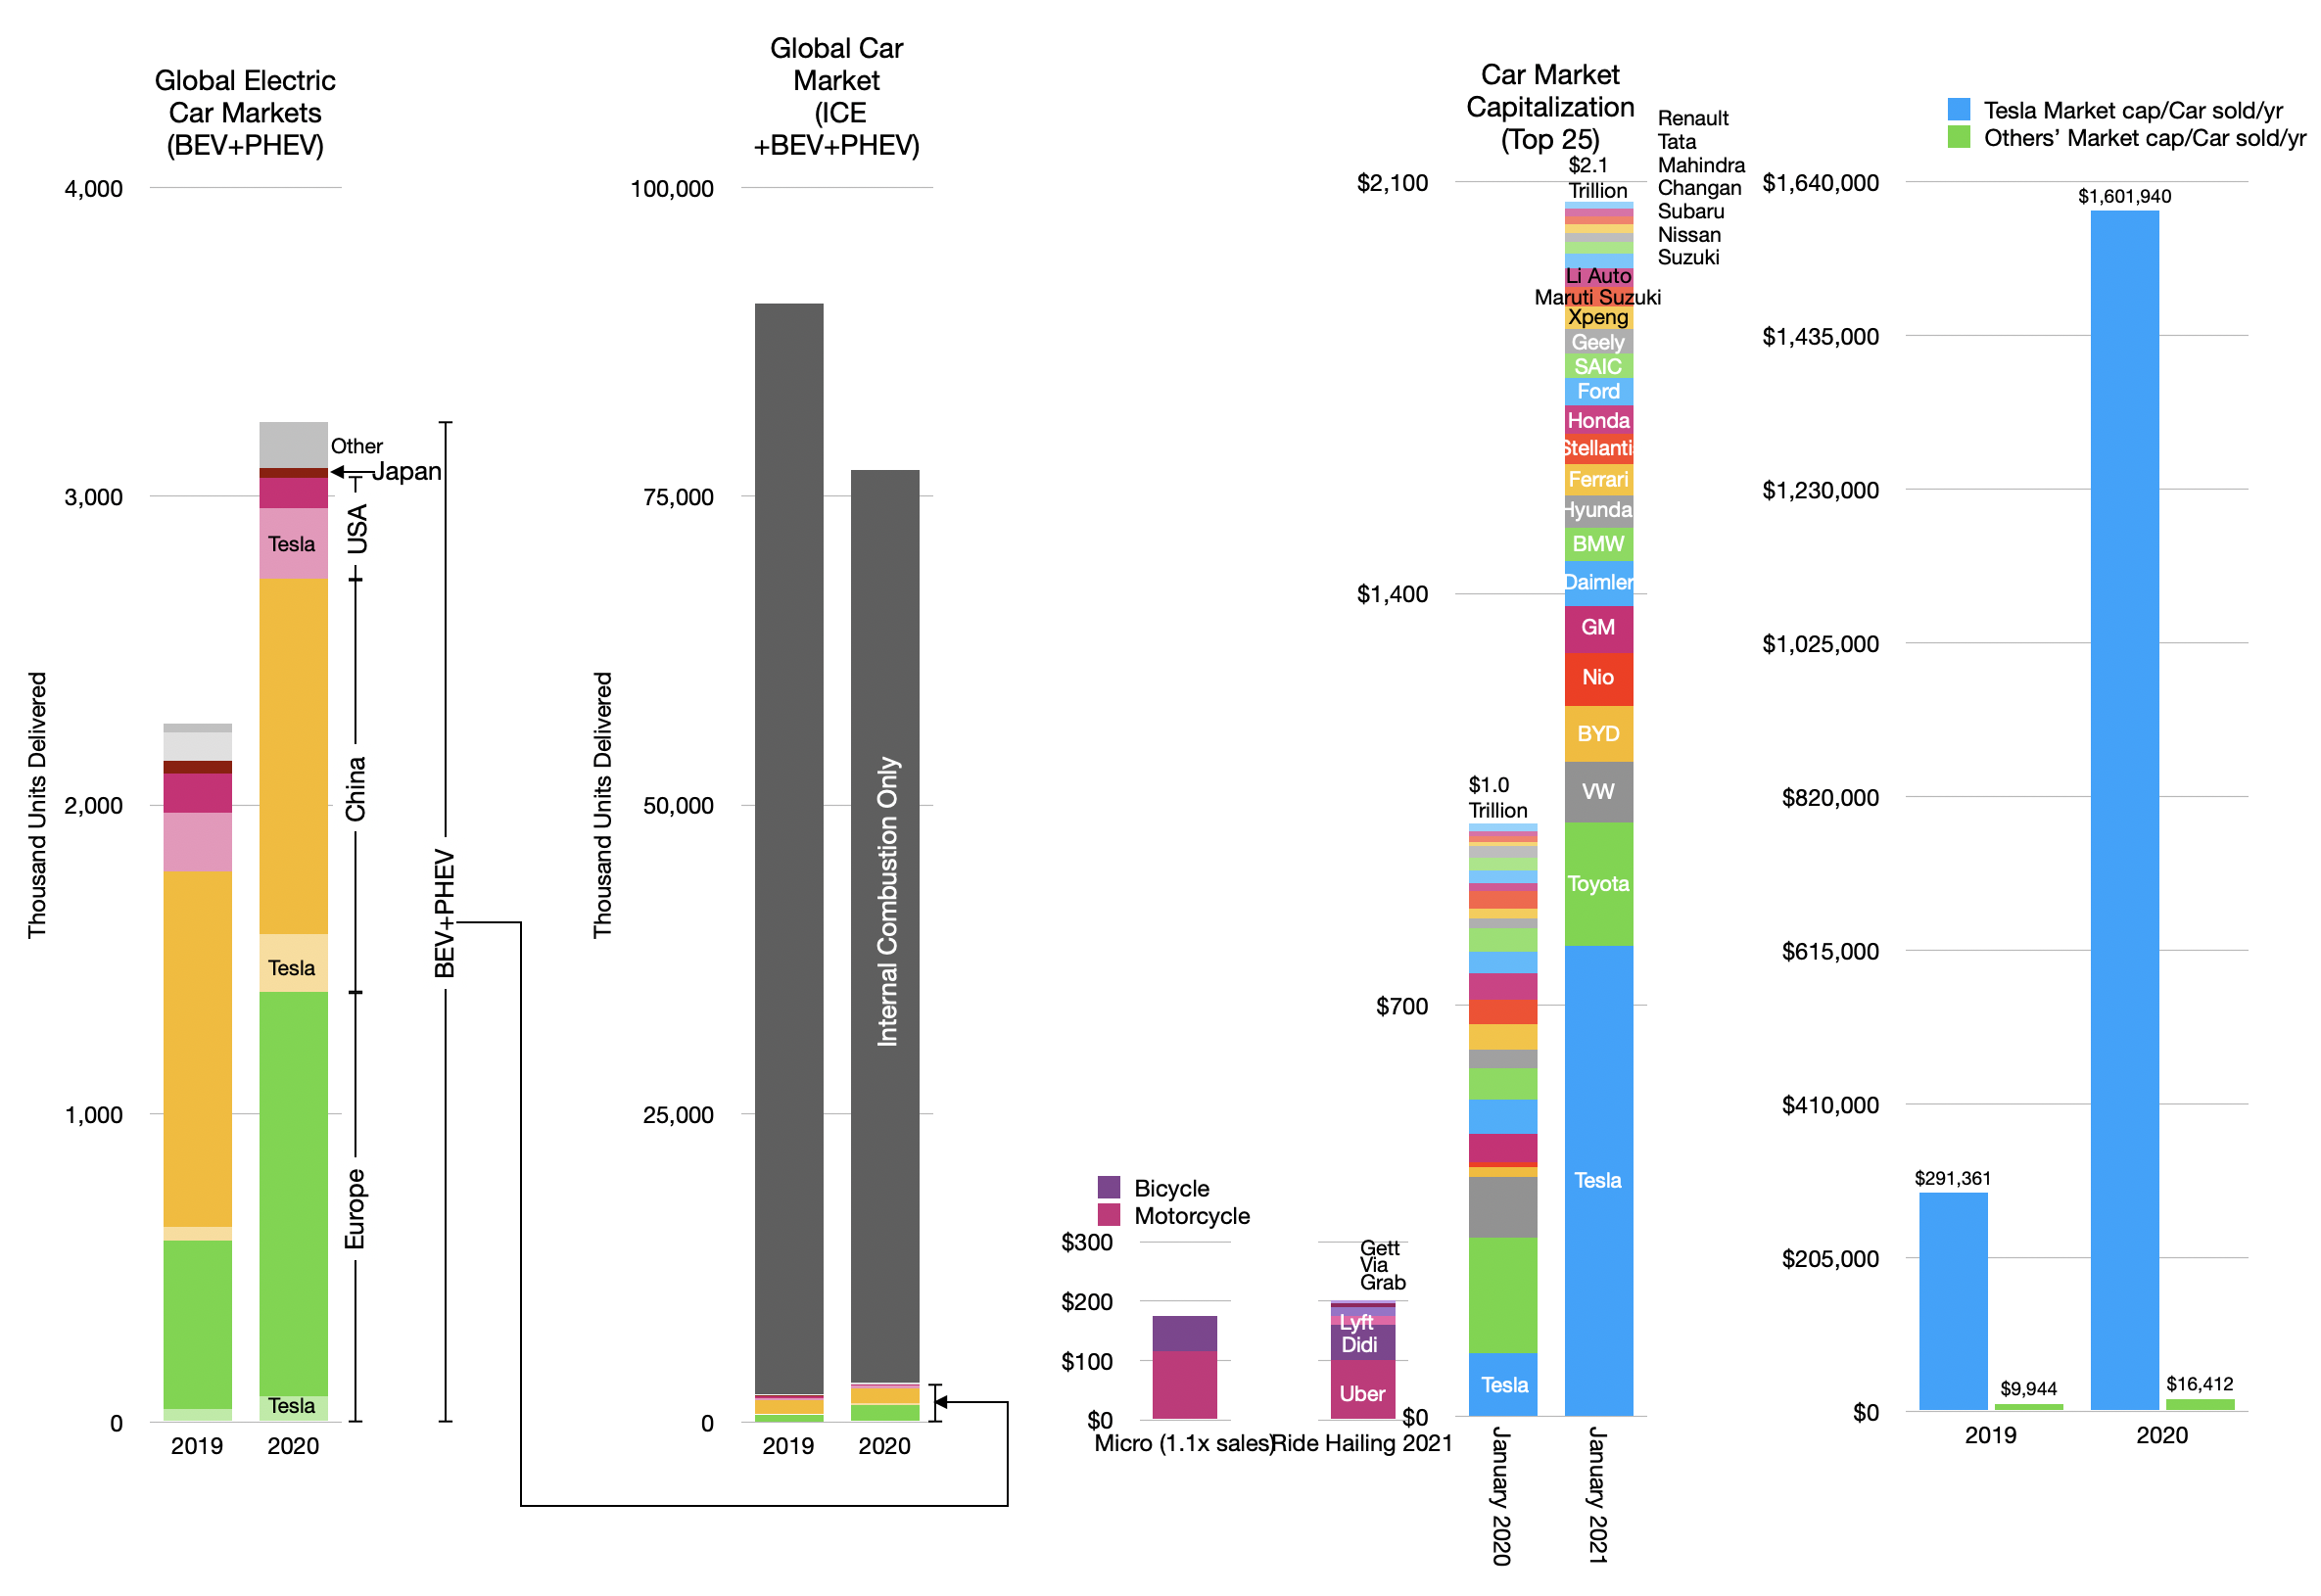
Note that micromobility is only measured by the value of motorcycles and bicycles whose markets are measurable and applying a 1.1 multiple to those sales yield a rough estimate of market cap.
It’s hard to get a measure on these jobs but I’ve taken to heart the idea that what you measure is most important in seeing what’s next and have been dividing the “market for miles” into short, medium and long distance trips.
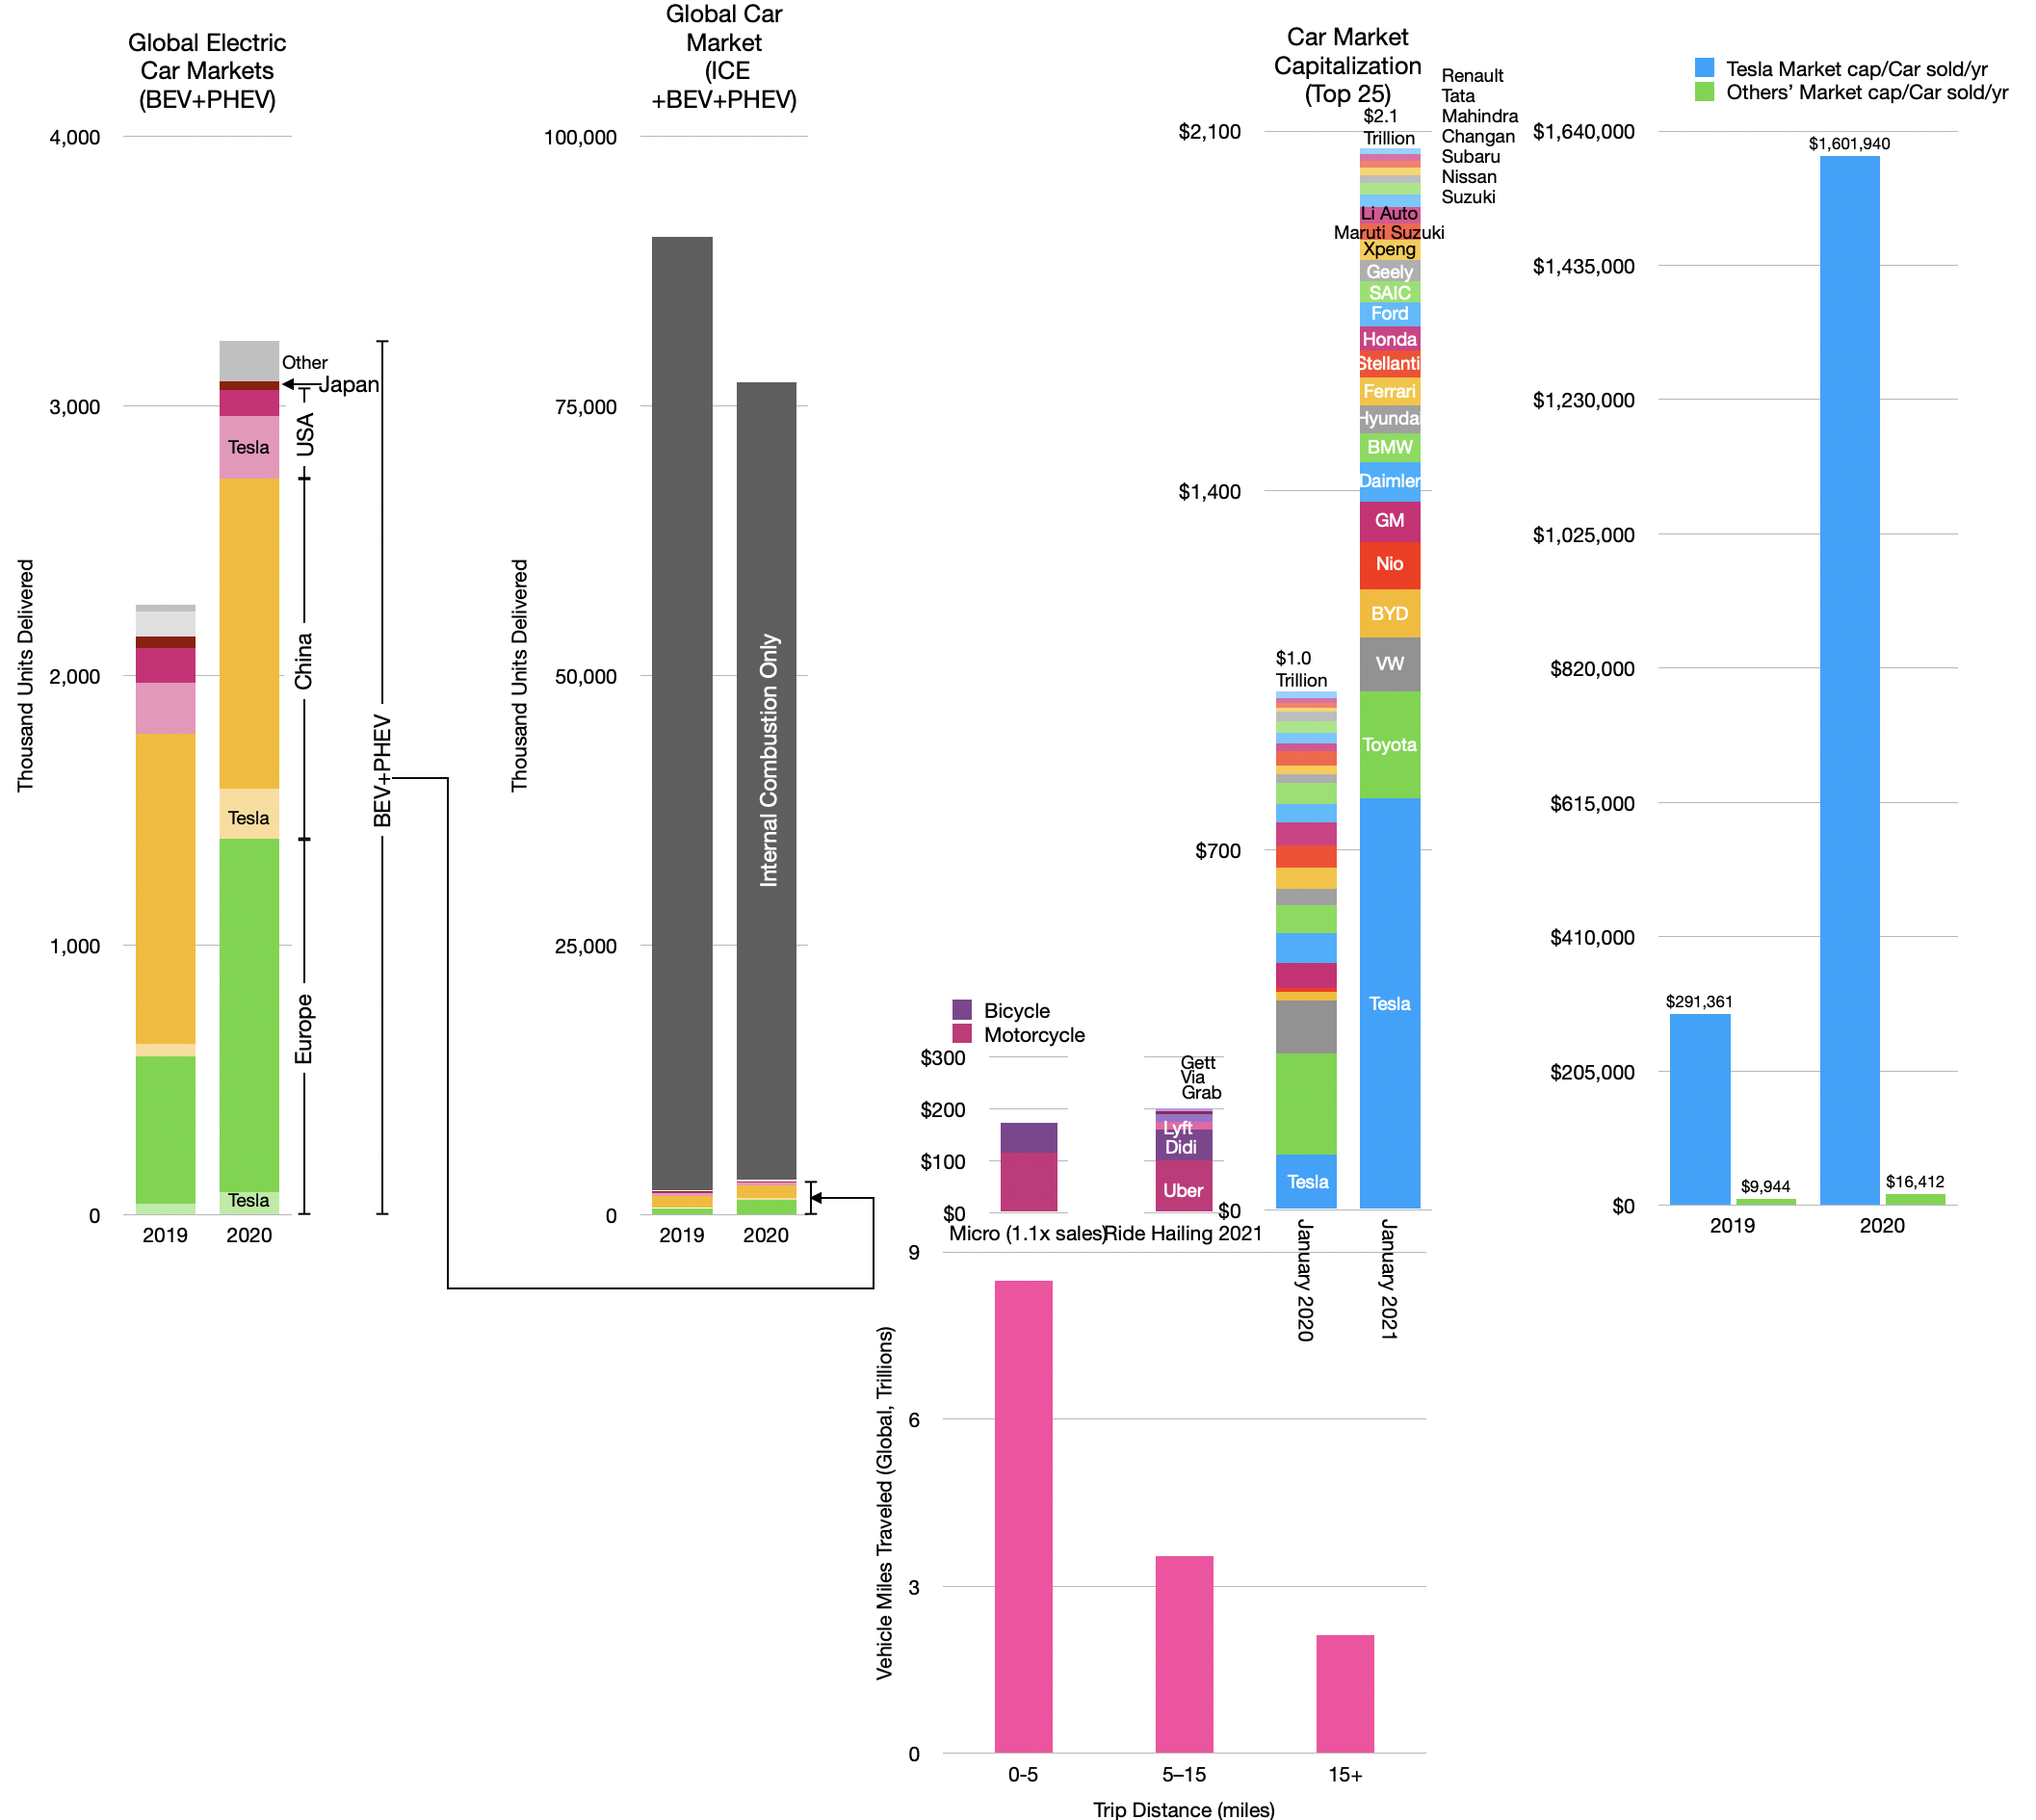
In the view above we get a sense of the scale of perceived value for businesses serving various trips. The inverted nature of valuation positioned on trips is, I believe, worthy of further analysis.
As the car today is a bundle, the design and engineering efforts are directed at serving the longest of long trips (with the largest payloads.) But the demand is for short trips.
If the car is to be unbundled (as the Personal Computer was into laptop, tablet, phone, wearables) then one can imagine that devices designed for short trips would accrue the value of those trips (and their popularity).
The absence of value in short trips is a paradox. Or perhaps it’s just an opportunity.
Discover more from Asymco
Subscribe to get the latest posts sent to your email.