The Pivot

The iPhone is the most successful product of all time.

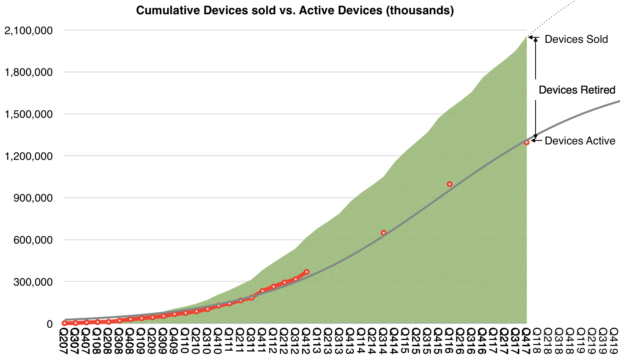
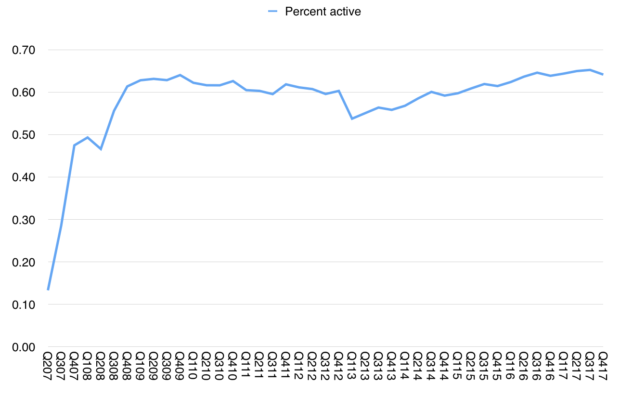
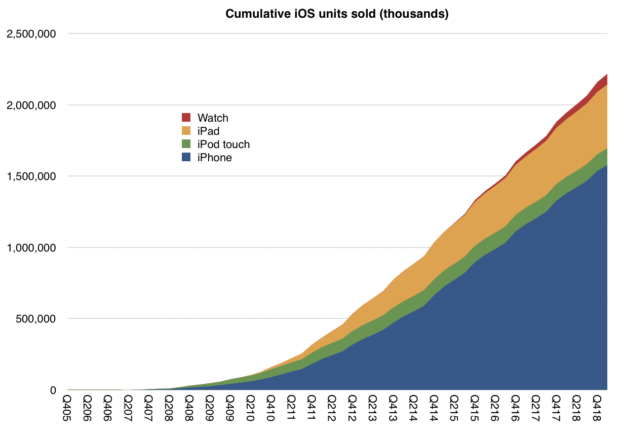
Over 1.6 billion have been sold. Including the iOS products it spun off, the total is over 2.2 billion. Of those 2.2 billion sold, 1.5 billion are still in use.

There are about 1 billion iPhone users.

Economically speaking, iPhone sales have reached one trillion dollars.1

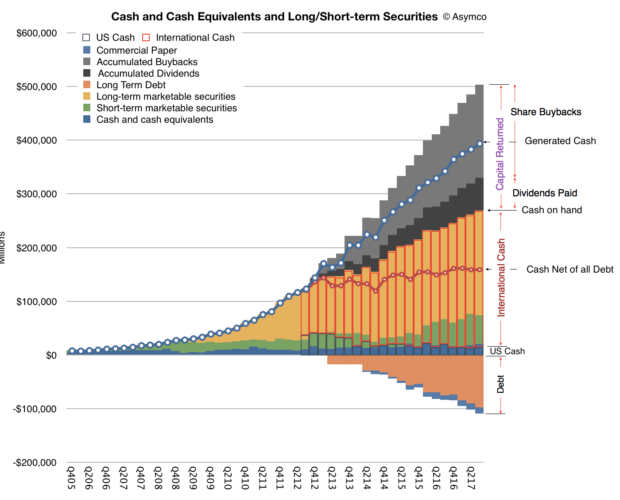
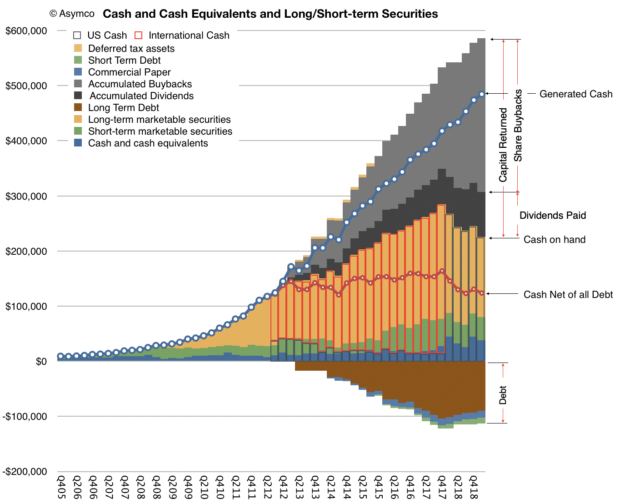
Since the iPhone launched, Apple’s sales have totaled $1.918 trillion. Of those trillions about one half a trillion was accumulated in the form of  income.

Of that half trillion in income, $360 billion was paid out to shareholders2. and $131 billion was paid in taxes.

This sounds like a good business, but no business is good if it is static. What makes a business great is dynamism. The idea is to constantly maneuver for a new or enhanced way of doing business as technologies enable entrepreneurs to fundamentally change how value is captured or allocated.

The iPhone story isn’t static, the “pivots” or change in direction are several:

  • The App Store, a platform for collaborative innovation where millions of developers are offered the chance to improve the product.
  • Accessories, a licensing model for third-party hardware that works with the iPhone
  • Distribution through multiple channels
  • Integration with other Apple Products
  • The marketing of older products alongside new ones at reduced prices
  • An expanded product portfolio with a broader range of prices
  • Trade-in and financing options

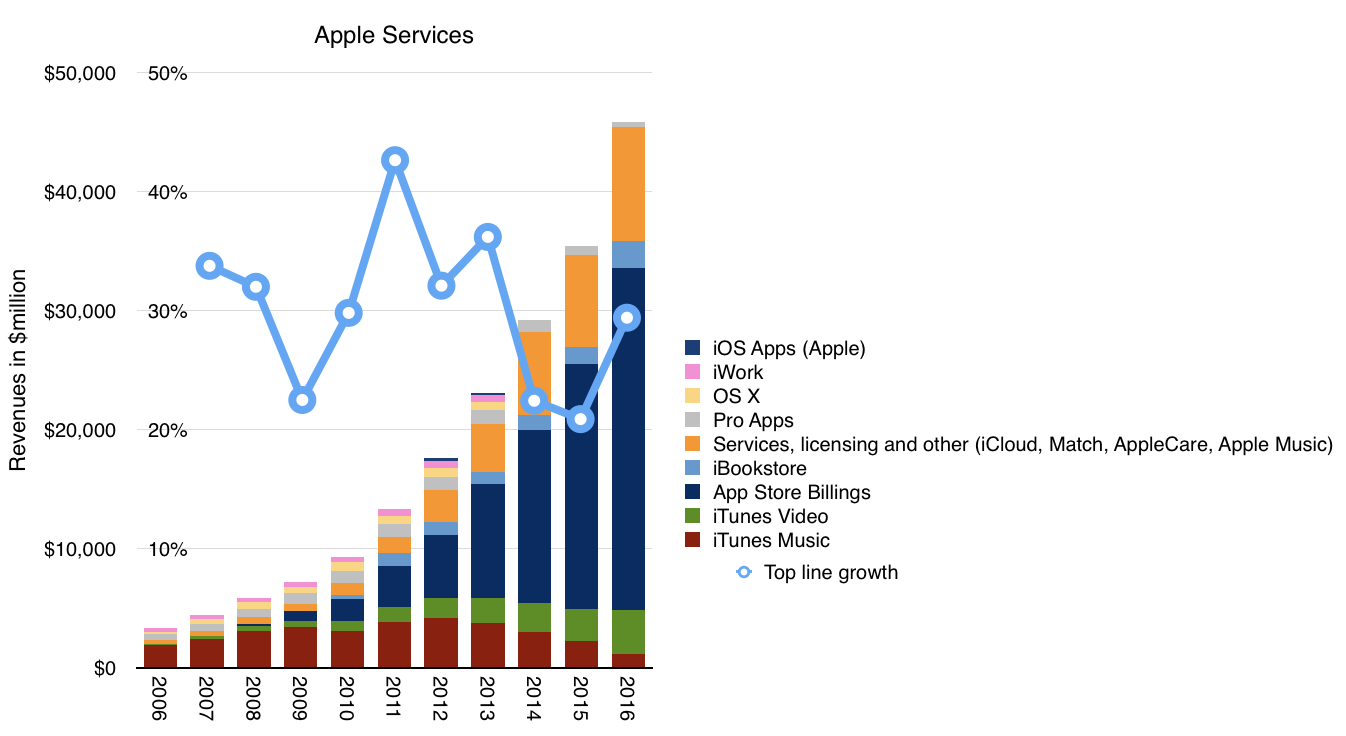
Each of these initiatives contributed to the iPhone growth story but the biggest change in business model was the addition of services. Apple Services grew out of the iTunes business that pre-dates the iPhone and was established to provide content for the iPod.

In 2006, the year before the iPhone launched, Apple customers spent $3.3 billion on iTunes, Software and Services. By 2018 the spending rate was $80.5 billion/yr. It’s very possible that this year’s spending rate will reach $100 billion/yr. This new division is simply called Services today and consists mainly of third-party apps and third-party content sales as well as licensing.

Recently Apple launched a set of new services that it will offer itself. This includes television, films, financial services and news. Apple already has a music service of its own and file storage (iCloud) both of which are offered as subscriptions.

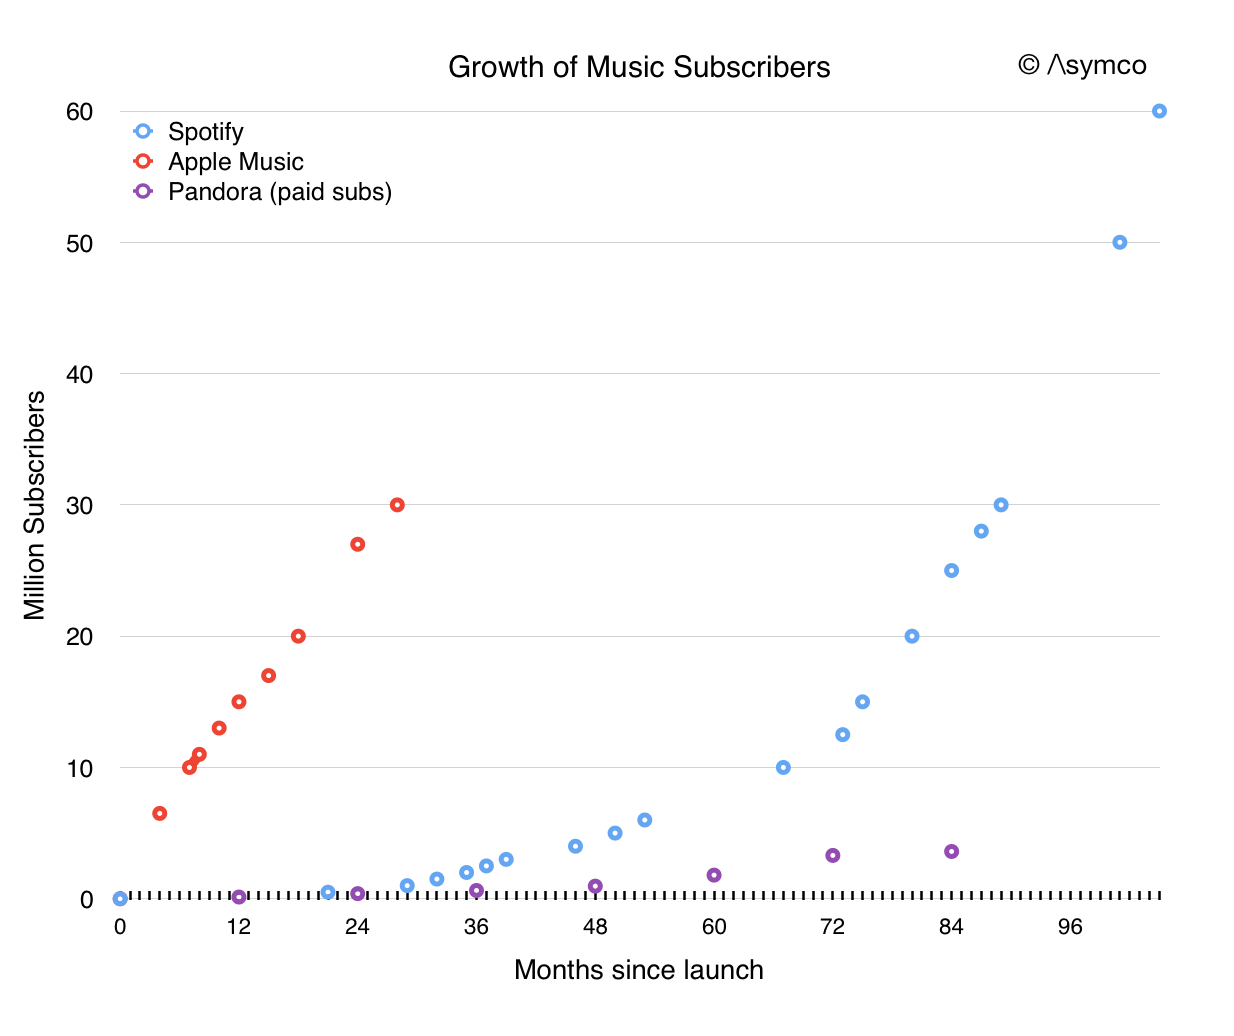
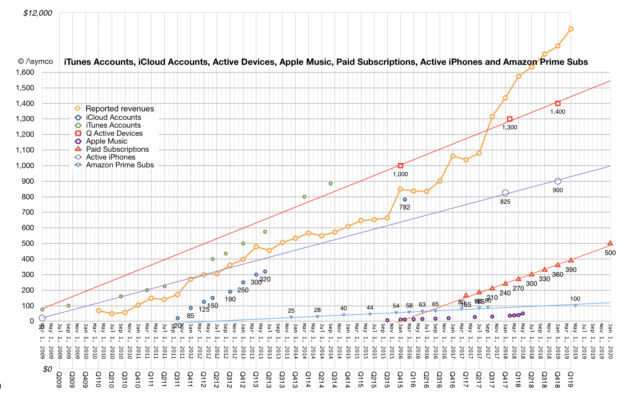
Apps are also allowed to offer paid subscriptions, and that total has reached 390 million, growing at 30 million a quarter with an expected total of 500 million by 2020. That amounts to one subscription for every other iPhone in use.

Some would argue that even with a $43 billion revenue rate, ($80 billion billing  rate)3 Apple’s business is still a hardware business and that comes with low margins, potential for disruption, non-recurring revenues and cyclicality.

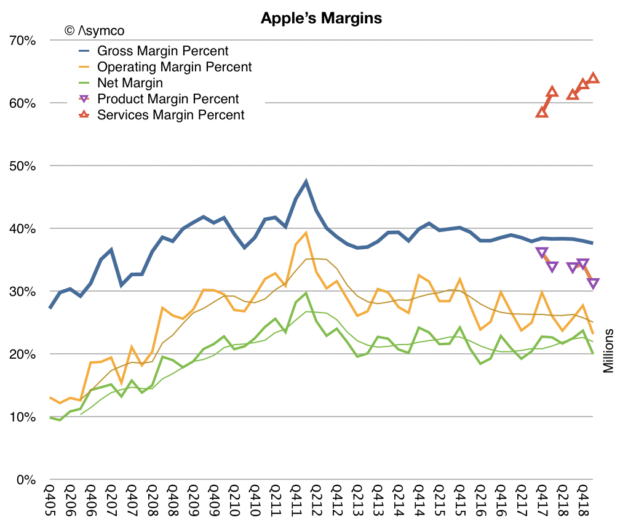
This is not the case. Apples’s business has high margins (64% gross margin for services, 34% for products), has been resilient over 12 years while attracting hundreds of imitators at lower price points, and has loyalty and satisfaction which results in more than 90% re-purchase rates. Cyclicality is driven by seasonality and product lifespans, not competition.


This common misconception of Apple is why it continues to be valued at a deep discount to not only peer companies who are services oriented (Google, Facebook, Microsoft and Amazon) but also at a discount to the overall market (the S&P 500).

Apple, since its inception, has always been oriented around its customers, not its products. The questions asked by management are “what can the company do to deliver experiences and satisfaction” rather than “what products can the company build”.

Every company is bound by its capabilities but the best companies re-shape these bounds because they are defined by priorities.

A priorities-driven company habitually re-designs its processes and its resources. A resources- or process-driven company re-designs its priorities as its capabilities change.

Moving as it does between computers, devices, software, services, retail, logistics and manufacturing means that it’s not classifiable as an “x” company where “x” is an industry sector. Rather, the company should be classified by the set of problems it seeks to solve (e.g. communications, community, productivity, creativity, wellbeing).

This disconnect between what people think Apple sells and what Apple builds is as perplexing as the cognitive disconnect between what companies sell and what customers buy.

Companies sell objects or activities that they can make or engage in but customers buy solutions to problems. It’s easy to be fooled that these are interchangeable.4

Conversely Apple offers solutions to problems that are viewed, classified, weighed and measured as objects or activities by external observers. Again, it’s easy to be fooled that these are the same.

This analysis is, of course, applicable to any company. Here I’m using Apple as a lens. This is because it’s just so much easier to tell this story with the narratives and anti-narratives that are so widely disseminated.

  1. The milestone of $1 trillion iPhone revenues was reached in the fourth quarter 2018 during which time the stock price of Apple fell by 40%. []
  2. As a result, the number of outstanding shares has decreased by 29% []
  3. The difference is in the way Apple accounts for App Store revenues: declaring only the 30% portion of sales that it keeps as revenues, and not including the 70% that is paid out to developers. The “billing rate” is what consumers spend, the “revenue rate” is what Apple reports. []
  4. They are only correlated. Purchase decisions are not *caused* by a product’s existence. The real cause is a combination of need and supply and time and circumstance of purchase. []

Just in Time

The iMac launched May 6 1998, exactly 20 years ago. It is not the most significant computer to ever exist. It was a clear descendant of the original Mac which established the “all-in-one” desktop computer category. That category, to which it still belongs, is a modest segment. The last time Apple reported portable sales separately was in late 2012 when the desktops/servers and pro systems combined made up only 20% of all Mac sales by units. If iMac were 10% of Mac sales, it would represent about 2 million units in 2017.

Desktops evolved into laptops and personal computing evolved into pocket  computing. Becoming more personal means more intimacy and this is leading to wearable computing. There is more beyond that to be sure.

But the iMac is a historically significant machine. It allowed Apple to start on a new trajectory. It did this by first offering a financial lifeline. Sales of Macs, which were at the time the only source of revenues for Apple, increased from 2.7 million to 3.8 million a year. This at a time when Windows PCs were shipping about 100 million units. That was enough to ensure survival. Today Mac units are five times higher while Windows PCs are about 2.5 times higher. The following graph shows the impact of iMac on the Mac’s trajectory.  Continue reading “Just in Time”

The Number

The first number that Tim Cook mentioned in the fourth quarter investor conference call was the number of active Apple devices. The 1.3 billion monthly active devices is the most important measure of the health of Apple’s business. It’s the primary way the company chooses to measure itself and it’s the best instrument available to understand the company’s strategy.

This is only the second time this number was revealed. The previous figure, given in January 2016, was 1 billion active devices. Thus, while Apple sold 586,744,000 devices1 the number of active devices increased by 300,000,000. While the number of units sold is frequently updated and attracts a lot of attention, the number of units active is very infrequently updated and attracts little attention. Yet the number of active devices speaks of the future of the company and should be carefully scrutinized while the number of devices sold speaks of the past and should be cursorily glanced at.

Dr. Edward Deming once said that the numbers that best define a company are two factors that do not appear on any financial statement. These factors are the value of a satisfied customer and the value of a dissatisfied customer. These factors must be multiplied by every other number in a financial statement in order to assess the prospects of the business. A high satisfaction leads to repeat purchases and referrals, growing the business; while a low satisfaction leads to ending relationships and a repulsion of potential new customers.

These numbers determine everything about the future and nobody quite knows what they are.

It’s tempting to suppose that, by asking, you can find out if customers are satisfied. Certainly the company cites these answers to the question of satisfaction and it’s partially useful to have some data. But customers are people and people are social beings. They are flawed in that they want to be liked and will use their powers of deduction to determine whether what they say will lead to their being liked more. Thus they will say things which they judge the listener will want to hear.

This auto-suggestion is especially likely when the answer (satisfaction) is so difficult to ascertain and the feeling is so fleeting.

You can’t rely on surveys alone to know if people like your product. You have to base that number on what they do.

This is where the active device data comes in.

A liked product will be used and a well-liked product will be used more. Usage is valuable not just in its intensity but also in its duration. When you see activity of a device it’s always a good sign if that is both frequent and long-lasting.

The following graph shows the history of cumulative devices sold by Apple since mid-2007, when the iPhone was launched. That total is now 2.05 billion devices. I have added early estimates on the number of active devices (in red) based on assumptions about product life-span. I added the company’s own reported figures since then.

I then tried to paint a continuous curve for this active number using a logistic function which assumes a diffusion into a population of addressable users, shown as the grey line above. The logistic curve is a good tool because it has a solid theoretical foundation in social behaviors.

The formula for this line is S÷(1+EXP(−1×(tog)) where S is the point of saturation or maximum population size, t is the period or count of quarters (1 for Q1 2007 and 2 for Q2 2007, etc), o is the offset to 50% or the point of inflection, in quarters, and g is the growth factor.

The S-curve above corresponds to S=1.8 billion, o=35 and g=8.

I chose these parameters because they best fit the data. It does not mean the reality will be precisely this but this is the best guess so far. It implies that there will be about 1.8 billion active devices sometime close to 2022 and tells us how we get there. This can and will change but for now this is the best guess using a theory that has worked in similar circumstances.

Working backwards from this active base estimate, we have predictive power on units sold, and even on revenues. However this is not the whole story. It’s not even the main story. What matters is what it tells us of the relationship between past behavior (purchases) and future behavior (use, referral, repeat purchase). This is hinted at by the ratio between purchases and active devices. In other words, the ratio between cumulative units and active units tells us whether the products are used and for how long. Having a continuous estimate of active uses allows for a reliable measure of satisfaction.

The following graph shows this estimate.

Note that the ratio remains remarkably constant. It’s currently about 64%. It’s so constant that perhaps we can invent a rule of thumb which says that two out of every three devices ever sold by Apple is still in use. And that this rule is always true.

This begins to be interesting.

The staying power and predictability of the business2 comes from a guarantee that activity is rigidly tied to purchase.

This speaks more than any satisfaction survey. It’s a measure of actions based on interaction rather than words based on human frailty.

There is no better number available to predict Apple’s business.

  1. This is an estimate that includes Macs, iPhones, iPads and Apple Watch but does not include Apple TV or accessories such as AirPods. []
  2. i.e. Free cash flow []

The Apple Cash FAQ

  • How much cash does Apple have?

To the nearest million, as of the end of September 2017, Apple’s cash and investments totaled $268,895,000,000. Note that this includes investments in the form of short- and long-term marketable securities. Long-term marketable securities are not always accounted as “cash” because strictly cash is considered a liquid asset and some securities may not be sufficiently so. Nevertheless, most analysts would agree that Apple’s securities are sufficiently liquid to qualify as cash. Note that for archaic reasons this cash is separated into US and non-US holdings with $17 billion located in the US.

  • Most businesses keep very little cash on their books. Why does Apple have so much cash?

Indeed Apple’s cash is extraordinary. It amounts to about 30% of its market capitalization. One reason is that Apple has taken many loans, totaling about $100 billion.

  • Whoa! Why would Apple need to take out loans? Does it have problems with cash flow?1

Quite the contrary, Apple’s operating cash flow is eye-watering. In the 2017 fiscal year (ending September) Apple generated $63,598,000,000 from operations. The loans are not needed to operate. They are used to pay shareholders.

  • Why does Apple need to pay shareholders?

Because it’s their money.

  • Wait, I thought you said this was Apple’s cash.

Apple is holding it for them but if it has more than it needs it’s obligated to return it. You see, If you were to look for “cash” in financial statements you find it on the balance sheet as an asset. Since it is growing and since a balance sheet has to balance, there has to be a liability that grows in proportion to offset the cash asset. That liability is called Shareholder’s Equity. This is a “debt” the company has to shareholders. If it pays out cash to shareholders then it zeros out an asset and a corresponding liability. The net is zero as far as Apple is concerned but shareholders get something in return for giving Apple money in the first place.

  • So hold on, it takes out loans to pay shareholders because it “owes them money” while it has too much money? This makes no sense.

Yes, welcome to tax laws. Although it generates more money than it can use, and that money should thus be returned to shareholders, some of the money is collected outside the US. US (and US only as far as I know) tax laws have a “repatriation tax” that is levied on money coming into the country.  This has nothing to do with corporate taxes which are levied on earnings. So after paying shareholders with the cash it had in the US, Apple had to borrow money to pay shareholders money they had outside the US.

  • Why not just pay the repatriation tax?

Because then shareholders would get less than 70% of their money. They would probably complain and blame the managers for being incompetent. Such blame usually comes with a lawsuit attached.

  • What about the new tax law that lowered the repatriation tax rate?

Now Apple has no option but to pay the tax and repatriate the cash. It’s still a tax. The amount will be about $38 billion or about 15%. Previous repatriation “holiday” levies were around 10%.

  • How exactly does the company give money to shareholders?

The payments are called “dividends” and shareholders must treat them as income–a form of double taxation because these funds are after the company paid earnings tax and possibly repatriation tax. Apple does pay dividends regularly but because of tax inefficiency (i.e. because government policy discourages dividends) the company mainly buys its own shares and retires them.

  • Huh?

Yes, it makes little sense but the math is simple. If the company buys its own shares and makes them disappear then existing shareholders will end up owning more of the company, making their shares more valuable. They can realize the gain if/when they sell the shares (and pay capital gains tax instead of dividend income tax on the already (double) taxed profits.)

  • Does that mean that it is going private?

No. The owners of the company remain the same: whoever owns shares owns the company and they can be traded in public exchanges. In theory they could reduce the share count to a single share and there would presumably be a single shareholder who would own the company, making it “closely held” but the company’s managers are still required to report and act as if it was public. Going private usually means a set of shareholders agree not to allow the shares to float on the open market and thus to also keep the affairs of the company out of public eye. It reduces liquidity and is generally harder for shareholders to exit their investment. This has nothing to do with reducing the number of shares in circulation–which is what Apple is doing.

  • But buying shares does not seem to affect the share price so the shareholders are not benefiting from the repurchasing. Isn’t this a waste of cash? Aren’t the shareholders being robbed?

The share price is an argument between shareholders and potential shareholders on the value of the company. It should reflect reality but many times it doesn’t. Over time however the math catches up with sentiment. In other words realization that there are fewer and fewer shares available compels people to not sell them, increasing the price. Short term investors tend not to pay attention to this but they are not the shareholders who Apple wishes to pay back anyway.

  • Why doesn’t the company spend the money on other things? You said they return what they can’t use. Why can’t they use it?

Simply, because it’s more than can be spent wisely. The company considers its mission to be very narrow: add value in specific areas where they can create tremendous value uniquely and under conditions (technologies and business models) they can control. Many such projects don’t require capital. Manufacturing, data centers and Apple stores require capital but R&D and sales not so much. Creating products is very cash efficient. For example, the iPhone–the most successful product of all time–cost almost nothing to develop; certainly nothing that required Apple to dip into its cash. Funding for the type of product development Apple does comes from existing cash flows and mostly consists of salaries for their employees.

  • What about acquisitions? Why not buy other companies?

It buys companies but usually small ones which are essentially acquisitions of teams and their intellectual property. Apple does not buy “business models” or customers or cash flows which is what large companies are valued for. Operationally, it’s also because Apple has a strong culture and it wishes to preserve it. Acquisitions dilute culture which is why integrations often fail. Statistically, large acquisitions are value destructive and the larger they are, the more likely they are to fail. Incidentally, when a company is acquired with cash that hole in the balance sheet is filled with something called “goodwill” which reflects some intangible value of the new asset. If and when the acquisition is deemed to have failed the goodwill is written off and so is shareholder equity. That’s how shareholders are robbed.

  • What about keeping it? Doesn’t having lots of cash make Apple more powerful?

As individuals we think that having lots of cash makes us rich. For companies it’s the opposite. Cash is a liability. If you come across a company that is cash rich and has nothing else, its enterprise value will be zero. Companies are valued on their future cash flows, meaning their ability to generate cash, not how much they managed to keep. In other words, cash is a measure of past success and investors are interested only in future value. That future value comes from the intelligent allocation of resources toward a valuable goal. A company rich in cash but poor in vision is likely to be taken private or broken up and shut down. Cash is an IOU to shareholders with a thank-you note for the support through the years.

  1. Companies often borrow because they need to plug gaps in profitability, best measured as “free cash flow”. []

Orthogonal Pivots

Microsoft has announced that by the end of the year the Groove music service will be phased out. Users are being offered the option to move their music libraries into Spotify.

This brings to an end a long story of Microsoft in the music distribution business. It started nearly 15 years ago with technologies in Windows that allowed for purchase and playback of various media formats. Microsoft sought to enable a large number of music retailers to market music through its formats and DRM and transaction clearing.

Services such as AOL MusicNow, Yahoo! Music Unlimited, Spiralfrog, MTV URGE, MSN Music, Musicmatch Jukebox, Wal-Mart Music Downloads, Ruckus, PassAlong, Rhapsody, iMesh and BearShare and dozens of hardware players licensed Windows formats. Almost all of these services have shut down and the devices disappeared.

The next stage was to offer an integrated experience through the Microsoft Zune player and Zune Marketplace music service. This too failed and was replaced by the Xbox Music brand in 2012. On July 6, 2015, Microsoft announced the re-branding of Xbox Music as Groove to tie in with the release of Windows 10.

There was a time when Microsoft was thought of as the certain winner in media distribution. Inserting media into the Windows hegemony was classic “control point” strategy: owning the access points was a sure way to collect a tax on what transacted through the network.

Instead we are facing a market where media is consumed through new access points: phones, tablets and TV boxes. Netflix, Spotify, Roku, Google, Amazon and Apple are all offering distribution and some are investing in original programming.

It’s perhaps worthwhile to recall that Microsoft and Apple both started their media efforts around the same time. Apple’s iTunes is 16 years old and the iTunes Music Store opened in 2003, almost 15 years ago. Today Apple is transitioning to streaming with 30 million subscribers. The graph below shows the history of subscription growth to Apple Music and Spotify.

Apple Music is a small part of Apple Services (part of the orange area below).

On a yearly basis Apple Services are this year crossing the $50 billion gross revenue run rate. This year Apple released a new Apple TV 4K and is releasing a new smart speaker called HomePod.

The contrast between Microsoft and Apple is most visibly between the Mac and PC. But the story of how media paralleled mobility and how Microsoft struggled with both is perhaps a cautionary tale.

Microsoft saw the limits of modularity when new product categories emerged and when new user behaviors were created. They attempted to pivot into being more integrated but those efforts also failed. The efforts continue today with Surface devices; looking forward they will continue with AR/VR and perhaps a pivot of Xbox..

But the long arc of history shows how hard it is to succeed in vertical integration after you build on horizontal foundations. Generations of managers graduated from the modular school of thought, specializing rather than generalizing. Now they are facing an integrated experiential world where progress depends on wrapping the mind around very broad systems problems.

Entire industries are facing this orthogonal pivot: media, computing and transportation come to mind. Huge blind spots exist as we see only what we’ve been trained to see.

S3X Appeal

On July 3rd, Elon Musk handed over the first 30 Model 3s and tweeted

“Production grows exponentially, so Aug should be 100 cars and Sept above 1500.”

He added,

“Looks like we can reach 20,000 Model 3 cars per month in Dec”.

In 2016 he stated

“So as a rough guess, I would say we would aim to produce 100,000 to 200,000 Model 3s in the second half of [2017]. That’s my expectation right now.”

He confirmed this estimate early in 2017

“Our Model 3 program is on track to start limited vehicle production in July and to steadily ramp production to exceed 5,000 vehicles per week at some point in the fourth quarter and 10,000 vehicles per week at some point in 2018.”

Overall 2018 production guidance has been 500,000 units and 1,000,000 units in 2020.

The company shipped 220 Model 3s in the July, August and September months. This is well below the expectation of 75,000 that the 2016 guidance would suggest1 or the 1,630 that might be suggested by the “production grows exponentially” July proclamation.

I entered the Q3 production data and kept the previous run rate predictions for Q4 and 2018 and 2020 in the following graph.


Continue reading “S3X Appeal”

  1. 100,000 to 200,000 for the second half of 2017 suggests an average of 150,000 for the six months or 75,000 per quarter []

A small-screen iPod, an Internet Communicator and a Phone

Apple is now the biggest watchmaker in the world, overtaking Rolex during the last quarter. This achievement happened less than two and a half years after Apple entered the watch market. Rolex, on the other hand, was founded in 1905, 112 years ago at a time when watches were the avant-garde of technology. Given this revelation of sales, we can test the estimates I put forward on the Apple Watch sales, shown below:

We know that Rolex produces about 1 million watches a year and we also know that Rolex had sales of $4.7 billion in 2016. The average revenue per watch1 was therefore about $4,700.

My estimate has been that Apple sold about 15 million Watches in the last 12 months at an average price of about $330. This puts the Apple Watch revenue run rate at $4.9 billion, indeed above Rolex.

They may be slightly high but the news makes me feel quite comfortable in my methodology. Note also that within the last quarter Apple said sales for the Watch increased by 50%. This is also reflected in my estimate of 3 million in Q2 vs. ~2 million for 2016 Q2.

Overall, about 33 million Apple Watch units have been sold since launch and they generated about $12 billion in sales. Coupled with a 95% customer satisfaction score, altogether, this has been a great success story. But only 2.5 years in, it’s still act one.

To understand the long term trajectory, it’s important to qualify this product as part of another, larger story. The Watch, even with LTE, is an accessory to the iPhone. It still cannot be activated without it. Even the coverage plan is an extension to an iPhone plan. The company is careful to address it as a companion product.

But how long will that last?

Continue reading “A small-screen iPod, an Internet Communicator and a Phone”

  1. Includes services such as repairs []

How much will the new iPhone cost?

The answer, regardless of when you ask, is: The same as the current iPhone.

Of course, this is the answer to the question of what will the average new iPhone cost. The average selling price (which combines the revenues and the volumes of all units sold and is reported every quarter) has not varied very much since early 2008. To the degree that there is variance (between $600 and $700) it is due mostly to seasonality and reflects a mix of more expensive units during the launch quarters and a cheaper units during later periods when the product is older and due for an update.

The graph below shows the average selling price as a dashed line and the corresponding prices of individual product variants available for sale in the US during the same time frame.1

The graph shows a high degree of consistency of pattern: Every year a new iPhone is launched which replaces the one launched the year before. The older product is still offered at a reduced price. Price brackets are very firm and set at fixed intervals about $100 apart.

A few minor changes in pattern over the years can be observed:

  • The original iPhone price changed due to a shift in subsidy model shortly after launch.
  • An increase of $50 mid-2011 when the iPhone became available unlocked.
  • Every three years a new, higher, price bracket is introduced, with a  doubling of maximum memory capacity.
  • The iPhone SE was introduced at a slightly lower price.
  • The last year saw a slight increase in the highest price.

The overall pattern looks like a staircase with a widening price range where the lowest price remains constant and the upper price rises every three years by $100.

The “floor” of the range is a consistent $400 while the “ceiling” has expanded from $700 to about $950.

This year’s ceiling is due for the fourth leg up and if the pattern persists, we should expect it to reach $1100.

This iPhone staircase has been built over 10 years and I don’t see it changing over the next three. I therefore drew the blank box over what I thought would be the price range from now until late 2020.

This is what I call the staircase model of Apple pricing. The staircase model must be understood in combination with the flat iPhone average price as the product matures.

As the product matures the user base grows (to nearly 1 billion today). Later buyers will opt for the lower price points, but the availability of higher, more aspirational models (sustained by the brand) means that a minority will gravitate upward, mainly because they can. This ensures that although the median and mode of the price trend downward, the average price stays the same.

The flatness of iPhone pricing is also to be understood in combination with the flatness of Mac, iPod and iPad average pricing (shown below)

The technique of preservation of average price seems to be in effect across Apple. In other words, the evidence suggests that Apple prefers to keep average pricing for all products constant. Individual variants are priced so that, as the category matures, the changing mix leads to consistency in price ownership.

Thus the iPhone can be seen as controlling the $650 point, the Mac $1200, the iPod $200 and the iPad $450. This pricing signals the product’s value and the value of the brand.

The signaling is not just to buyers but also to competitors. Ownership of price forces competitors to occupy adjacent brackets. This process begins at launch: the new Apple product is introduced in what is perceived as a premium stratum2 thus the reaction from competitors is to “undercut” it. But, as Apple climbs the price staircase, preserving the floor, it keeps competitors bunched up at the bottom. Competing in the same brackets with Apple is futile as other brands can’t sustain the perceived premium position.

The result is a remarkable consistency of average pricing which, coupled with a remarkable consistency of competitive positioning, coupled with a remarkable consistency of customer satisfaction and loyalty, leads to a remarkable predictability of cash flows and ability to invest in new product creation..

Apple is thus quite easily understood as a remarkably consistent consumer products business. The only surprise that remains is how long it takes for that understanding to propagate.


  1. Prices outside the US vary depending on duties, taxes and currency hedging but generally are based on the US price []
  2. See for example the pricing of the new HomePod []

Other Products

From the way Apple reports its revenues you might think that the company has several operating segments. There are the iPhone, the Mac, the iPad for which units and revenues are reported. Then there are Services and Other Products for which we have revenues only.

Services is a collection of all non-hardware revenues and is (finally) being recognized as a non-trivial business. With reported revenues of $26.6 billion in the last twelve months, it’s big enough to be a Fortune 100 company and set to double in four years.1

That leaves “Other Products” which now becomes the revenue segment that is  “most likely to be ignored.” This segment had revenues of only about $11.5 billion in the last 12 months which would place it at only a Fortune 245 ranking, equivalent to a Toys “R” Us or Biogen. How should we value Other Products?

Other includes many hardware products including iPod, Apple TV, Beats, Apple Watch, AirPods and, soon, HomePod. Each is a significant product, with Watch probably the largest single contributor. But since we don’t have specific unit numbers, we are left guessing at the contribution of each.

The Watch itself has been a point of scrutiny as it could be initially teased out of the mix through an observation of the before-and-after launch vs. trend-line as shown below:

This separation of Watch became harder to discern after the launch of AirPods. Though they are still very hard to obtain, they might be “moving the needle” by now with a contribution that would muddy the Other category further. Same with updated Beats headphones.

Continue reading “Other Products”

  1. Although a non-zero business, the valuation of Services continues to confound observers who cannot separate it from the hardware businesses it attaches to–which themselves are considered near commodity value–thus paradoxically valuing the overlying asset of Services near or precisely at zero. Incidentally, Facebook is Fortune 98 at $27.3 billion and it is also one of the top 5 largest business by market capitalization. []

The Genealogy of the MacBook Pro

I was an early user of the first MacBook Air. When that product was launched I saw in it something different: a dedication to a new measure of performance: thinness and conformability. The key image used to launch the Air was the laptop sliding neatly into an inter-office envelope. The implication was that the laptop does not need to have its own special “laptop bag”. It could fit into any bag. Users would be able to slip it into all manner of new contexts. It sought to compete with computing non-consumption.

The Air was launched by Steve Jobs in 2008 and was almost universally panned. It was considered underpowered and the dedication to thinness was seen as irrelevant to what consumers wanted. The stock price fell.

The product went on to become Apple’s most popular laptop. It still is. It grew the base of Mac users to over 100 million today.

For the same reason, I was an early adopter of the newest MacBook Retina. The even thinner new MacBook was spectacularly thin. It was smaller than an iPad. It had no ports except one USB-C and a headphone jack. It required dongles for physical connections. It had a new keyboard that barely registered movement and it had a new trackpad that did not move at all but played mind tricks to make you think it did.

As I used it over the last year, I became used to it. It was not my only laptop. I had an older 15 inch Pro, but over time I came to use the MacBook Retina exclusively. I thought I could not do “real work” with it but I managed. I got used to the keyboard. I got used to the trackpad. I got used to the need for a dongle to connect a display. But these challenges were more than offset by delightful improvements. I was delighted by the small power brick and the ability to use any USB power to charge it. I was delighted at the all-day battery life which meant I would charge it the way I charged my Phone: at night.  I was delighted that I could use it in places where I could not use a laptop: on any airplane tray, stowing it in the seat back pocket. And I no longer cared what bag I had for my computer. It did not make me productive by completing tasks more quickly. It made me more productive by letting me be do things when and where I otherwise couldn’t. I love my MacBook.

Now Apple launched a new Pro Mac laptop.The new Pro laptop has the same (slightly improved) keyboard as my MacBook. It has the same (larger) trackpad as my MacBook. It has the same (but more of) USB-C port.  It has something new called a Touch Bar which puts function keys into a touch screen but mainly it feels like a grown-up version of my MacBook Retina. It’s faster too.

Overall, the new MacBook Pro feels to me like an evolution of the MacBook of 2015. I remember at the time thinking that this baby MacBook is probably the wave of the future: the new keyboard, new trackpad, new thinness, new USB-C, deprecation of other ports. These required enormous engineering efforts and it would be silly to leave them on only one model. In any case, from where I was standing all these were “better”. Not along the previous definition of goodness but along a new definition: making the computer more conformable and easier to put into use in more places. The very ideas that drove the development of the Air of 2008. Indeed the very idea that drove the development of laptops since the 1990s.

What’s fascinating to me from a product management point of view is that the groundbreaking new features which re-define the product’s direction are not designed to trickle-down from the top-of-the-line to the bottom, but rather that they trickle-up. The low-end product gets the updates first and the the Pro products adopt them later.

And we can even trace this genealogy of features through to an even “lower-end” product: the iPhone. The iPhone “ethos” of usability and conformability has permeated through to the Macs, starting from the lowly and advancing to the top of the range. The question of where Apple’s design direction comes from can be answered: the bottom.

All this is consistent with a strategy of “low-end evolution”. A way to defend the low-end rather than abandon it in pursuit of what the most demanding customers are asking for. Rather, Apple seeks to incubate a new performance measure. Re-defining goodness.

So is this new MacBook Pro a worthy successor to the MacBook Retina? My attention is riveted by the Touch Bar. It seems a completely new way of interacting but requires discovery and practice. What Apple has to achieve is allow the product to work well without it but also to allow users to evolve their experience with it. Over time we got used to trackpads instead of mice (many resisted the change). We got used to a different, small travel keyboard. We got used to new ports (HDMI vs. VGA) and we got used to wireless everything (it may seem easier, but remember having to always enter credentials vs. plugging in a cable).

The touch bar is a new UI metaphor. It will take time but it is looking at me right now, winking.