Every quarter I try to score growth by top, bottom and product lines. As unforeseen growth is the only driver creating shareholder value, it’s of paramount importance to measuring a company’s performance.
For Apple, the analysis is fairly straight-forward. There are relatively few product lines (seven including the iPad). I measure y/y sales growth and try to form a picture that is easy on the eyes and mind.
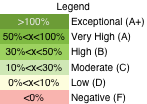
The method I’m using now is color coding growth for each line according to the legend to the left.
The table that follows shows each product plus the Net Sales and Earnings lines according to this color coding. I also added an average column for reference.
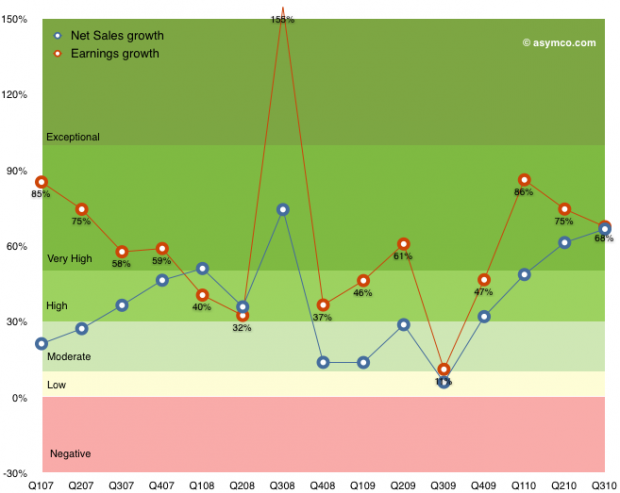
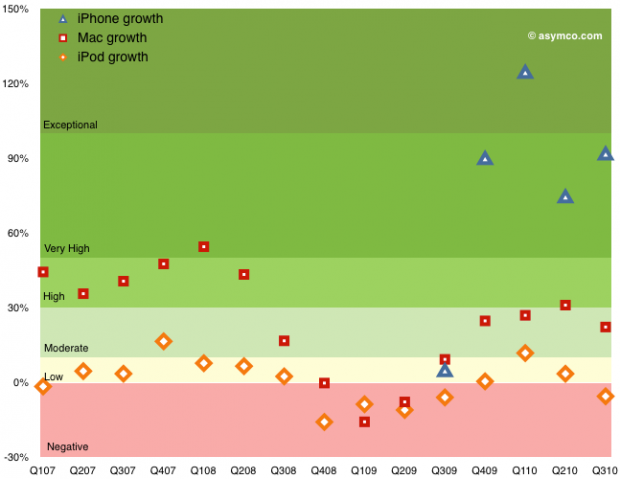
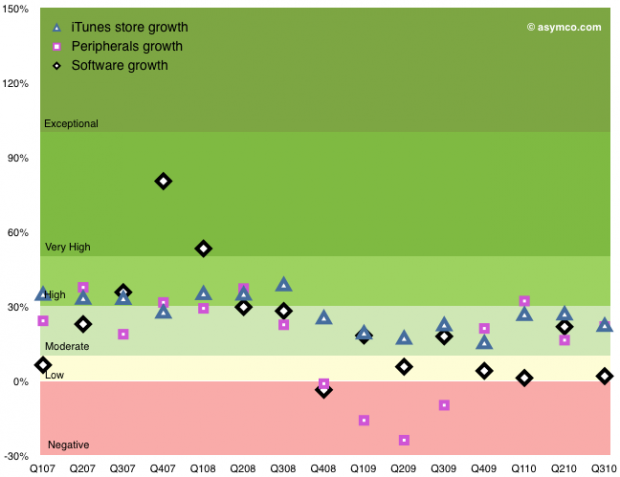
The following graphs show the same data with color coding for the rates as they change over time. I broke the data into three charts: Top/Bottom lines, Hardware Products, Other Products.
Discussion
Hopefully this representation describes the company’s growth without requiring too much explanation. Earnings growth, which determines ultimate value created is near all-time highs, well into the “Very High” (A) growth band. Apple have recovered from the Moderate-to-High (B/C) bands during the recession and are near the levels of 2007 when the company was trading at a P/E of 50 (today’s P/E for Apple is 20). Sales growth broadly followed earnings growth.
Within the products, the iPhone again shows exceptional performance. The growth during the first five quarters was (literally) off the scale (above 150%–see table for actuals). The average quarterly y/y growth has been 234%! Last quarter’s 92% growth is very near the 100% threshold for exponential growth. This after three years in the market.
The Mac growth is Moderate (B) and that may be because it was not a launch quarter for portables. The Mac underwent Very High (grade of A) growth for a period of 2008. The iPod shows weakness. The product has been in a Low-to-Negative (D to F) band of growth since the iPhone launched. Clearly a mature product line but one which has been largely subsumed into the iPhone and iPad. The iPod touch is increasingly a large proportion of the iPod line.
The non-hardware product lines are Low-to-Moderate growth products. The Peripherals business tracks very closely to the Mac business and dipped negative during the recession.
Overall, the growth scorecard is in the “Very High” category, or a grade of “A”, mostly driven by the iPhone and iPad. Whether this growth will be reflected in the share price is a question reserved for a future discussion.


