iPhone share of all phones sold is now above 4% and continuing to rise

I am dead serious. I am now convinced that we have enough data to determine for a fact that Apple will not only see a dramatic decline in quarter-on-quarter sales in units of the iPhone this January-March quarter (which is the predictable pattern and no surprise) but that we will also see a decline in iPhone market share against at least HTC and Blackberry;  that would be demoralizing news in itself. I know now that the numbers are clearly stacking up so, that the annual sales level of iPhone units, will result in a decline in iPhone annual market share in 2010.

via Communities Dominate Brands: iPhone in Memoriam: A History from its Peak Moment of Success. But who copied whom?.

Contrary to the loud and emphatic proclamations above, the data shows that the iPhone’s market share gains have been steady.

The following chart shows iPhone market share by quarter with a 4-quarter moving average. Total market size is reported by IDC. Continue reading “iPhone share of all phones sold is now above 4% and continuing to rise”

Apple trading even with the S&P 500

From the Apple 10K:

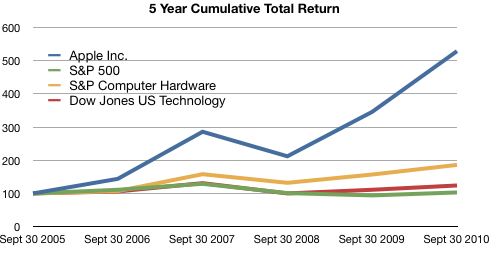
The following graph shows a five−year comparison of cumulative total shareholder return, calculated on a dividend reinvested basis, for the Company, the S&P 500 Composite Index, the S&P Computer Hardware Index, and the Dow Jones U.S. Technology Index. The graph assumes $100 was invested in each of the [securities].

In other words, if you had invested $100 in the S&P 500 in September 2005, you would have $103 now. If you invested $100 in Apple in September 2005, you would have $529 now.

Apple investors should rejoice!

However, in terms of reward for earnings, consider the following graph: Continue reading “Apple trading even with the S&P 500”

Turley Muller: Warranty Expense Crimps Apple's Margins in 4Q10

If estimated warranty expense had remained constant in absolute dollar terms ($150M), GM would have been 38.4% vs 36.9%. If If estimated warranty expense had remained constant in as a percentage of revenue (1%), GM would have been 130bps higher at 38.2%.

via Financial Alchemist: Warranty Expense Crimps Apple’s Margins in 4Q10.

Muller spots the culprit in the margin drop. He notes that this is money set aside and may have been in anticipation of returns of the iPhone 4 due to antennagate. Note how in 3Q cost of claims was 155 and accruals were 157, about a 1:1 ratio whereas in 4Q costs were 286 and accruals were 457 about 1:1.6.

It’s possible that if the costs this quarter do not materialize then we could see a margin upside surprise.

(Contrast this insight with today’s large scale sell-off in shares due to mass media repetition of earnings guidance from the conference call as shocking “news.” See also evidence of unlawful trading behavior here.)

LG continues to lose money in mobile phones

LG saw its profit fall apart today as its summer results were hurt by its weakness in phones. Its profit plunged 99 percent, down from $805.6 million a year ago to $6.7 million. The Korean company was dragged down by its mobile group, which had a record loss of $270 million. The company’s total phone shipments also dropped, going down 10 percent from year to year at 28.4 million.

via LG profit collapses based on shrinking phone sales | Electronista.

Q3 numbers show that LG had a drop in ASP as well. The unit numbers are down sequentially from 30.6 million in Q2.

Re-framing the dichotomies: Open/Closed vs. Integrated/Fragmented

Google likes to market itself as “Open” in contrast to “Closed” alternatives.

Apple likes to market itself as “Integrated” in contrast to “Fragmented” alternatives.

These dichotomies are judgmental and meant to portray “us=good” vs. “them=evil”. Neither gets to the point of how the two companies are structuring their businesses relative to the mobile computing value chains and clouds the judgement of observers.

I propose using a more informative and less judgmental distinction. It’s a division defined clearly by Clayton Christensen in his classic “The Innovator’s Solution” from 2003.

He introduced the concept of interdependent vs modular systems. Continue reading “Re-framing the dichotomies: Open/Closed vs. Integrated/Fragmented”

Motorola ships 3.8 million smartphones

Sales from its handset business climbed 20 percent to $2 billion last quarter, helping to narrow its loss to $43 million from $216 million a year earlier. The division had an operating profit, excluding some charges, of $3 million. Motorola said it shipped 3.8 million smartphones last quarter.

via Motorola Profit Tops Estimates on Rising Sales of Droid Phones – Bloomberg.

Motorola shipped a total of 9.1 million phones. This is down 33% from the year-ago quarter’s 13.6 million units but up 10% sequentially from 8.3 million last quarter.

I’ll summarize the top tier vendors’ unit volumes, sales value, price and profitability in a few days.

Wall Street's Infinite Loop: How AAPL is valued

In the previous article discussing the growth scorecard, I left open the question of how Apple’s growth is reflected in its share price.

The approach to answering this question is to show how the share price correlates to that growth. The challenge for analysts has been that the company switched from subscription to current accounting for the iPhone (the largest component in its income statement). As they re-stated income and thus earnings, any historic review of P/E or other multiples of Earnings have to also be re-computed.

So this is what I’ve done: Continue reading “Wall Street's Infinite Loop: How AAPL is valued”

Apple's Growth Scorecard

Every quarter I try to score growth by top, bottom and product lines. As unforeseen growth is the only driver creating shareholder value, it’s of paramount importance to measuring a company’s performance.

For Apple, the analysis is fairly straight-forward. There are relatively few product lines (seven including the iPad). I measure y/y sales growth and try to form a picture that is easy on the eyes and mind.

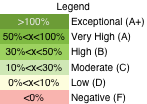
The method I’m using now is color coding growth for each line according to the legend to the left.

The table that follows shows each product plus the Net Sales and Earnings lines according to this color coding. I also added an average column for reference.

Continue reading “Apple's Growth Scorecard”

Sony shares up on speculation of Apple interest

TOKYO (Reuters) – Shares of Sony Corp rose nearly 3 percent on Tuesday as traders cited media reports speculating that the Japanese electronics maker could be a potential acquisition target of Apple Inc.

via Sony shares up on speculation of Apple interest – Yahoo! Finance.

There’s a sucker born every minute. That phrase, (erroneously) attributed to a major benefactor of my Alma Mater, continues to ring true today.

Although Steve Jobs once admired Sony, the company today contains nothing of value to Apple. A disruptor is unlikely to buy the company he just disrupted. Would Sony have bought Westinghouse? Would WalMart have bought Sears? Would Microsoft have bought IBM in the 1990’s?

When considering an acquisition the chances are that the asset being purchased is going to ask a premium price. So the buyer has to answer this question: what is it about the asset that makes it worth more than the market price?

There are three (and only three) sources of value that a buyer can buy:

  1. The resources (intellectual, physical, contracts, channels or employees)
  2. The processes (the algorithm of how those resources are put to use)
  3. The business model (the way the assets and processes and applied to create profits).

A company like Sony has some resources but its processes and business model are obsolete. Should Apple pay a premium for Sony’s assets? I don’t see a reason why.

Visualizing Apple's Profitability

After the last earnings report, many noted that Apple’s gross margins dipped. Turley Muller noted in a letter to PED that the cause was probably the aggressive ramp in iPhone 4 production which broke new records at 14.1 million units.

That may be. My estimate of iPhone margin shows it dropping to about 49% from the more usual 55% (sometimes even higher).  We’ll never know exactly how much, but sometimes margins drop. RIM and Nokia are punished for drops in the GM percent so why shouldn’t Apple?

However, there are some other factors to consider: the overall margin is currently historically very high. As the high-margin iPhone makes up more of the total product mix, the overall margin should be growing. And it is. The chart below shows the trend since 2005. GM was in the high 20’s five years ago.
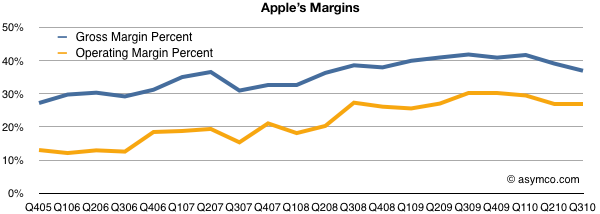
Note however the other margin: operating margin. After taking the fixed costs into consideration (which we saw to be shrinking as a percent of sales), Apple’s bottom line profitability has been rising slightly more rapidly than the GM. It has plateaued recently but not dipped significantly.

Also note that there have been dips in the past from which GM expansion resumed. One such dip was at the launch of the first iPhone in 2007, though we can’t be sure that was attributed to the iPhone itself or to other factors like that most cited by management: components costs.

However, the bottom line profitability is only part of the picture. It would be instructive to look at which product contribute how much. You won’t see this analysis often because the gross margin by product is not published by Apple and it takes quite a bit of guesswork to get there.

I maintain product-level gross margins and compute the overall GM bottom-up. The product-by-product line profitability is based on several assumptions which I won’t detail here, but those assumptions lead to the following contribution chart: Continue reading “Visualizing Apple's Profitability”