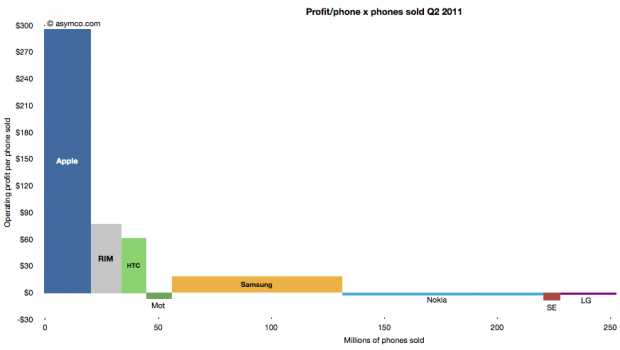
The following chart shows the current profit distribution between phone vendors with an eye toward identifying volume dependencies. The vertical axis represents operating profit per phone and the horizontal axis the number of phones sold.
The area of each vendor bar is therefore the total operating profit that vendor captured. A vertical (portrait) orientation implies high profitability with relative low volume while a horizontal (landscape) orientation implies a high volume/low profitability focus.
The other important observation is that bars can also be negative. Those vendors’ names are listed below the bars rather than within them.
You can also compare the chart with the one from last quarter:

