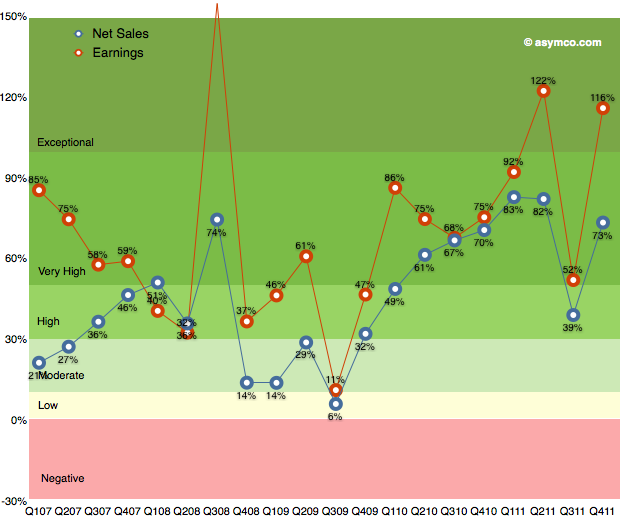
After the transitional third quarter, Apple’s earnings growth returned to an exceptional level. As the following chart shows, earnings growth has maintained above 50% growth since 2009.
Q3 turned out to be a transitional quarter with 52% growth but Q4 proved to be “exceptional” with growth above 100%. This is the third highest rate of growth in the five year span shown. Sales growth was also very near the top of the range, coming in fourth historically.
When looking at the components making up sales, we can see each product line’s revenue growth in the following table: 
The growth leaders were also the largest product lines in terms of revenue. iPhone and iPad had triple digit growth rates and that translated into the bottom line growth.
Music related products and services which Includes revenue from sales from the iTunes Store, App Store, and iBookstore in addition to sales of iPod services and Apple-branded and third-party iPod accessories grew at 42%. This is the highest rate during the time frame shown.
Peripherals which Includes revenue from sales of displays, networking products, and Apple TV was next with 29% revenue growth.
The Mac line followed with 22% growth and Software which includes sales of Apple-branded and third-party Mac software, and services through the Mac App Store grew at 7%.
The iPod line continued to shrink with -26% decline.
I used color coding in the table to show the patterns of change and what I note is that the iPhone and iPad lines continue to be exceptionally fast growing businesses. The duration and amplitude of these streaks of growth should be a clear signal about the dynamics of these markets and Apple’s role within. Too often, I find, these signals are ignored.

