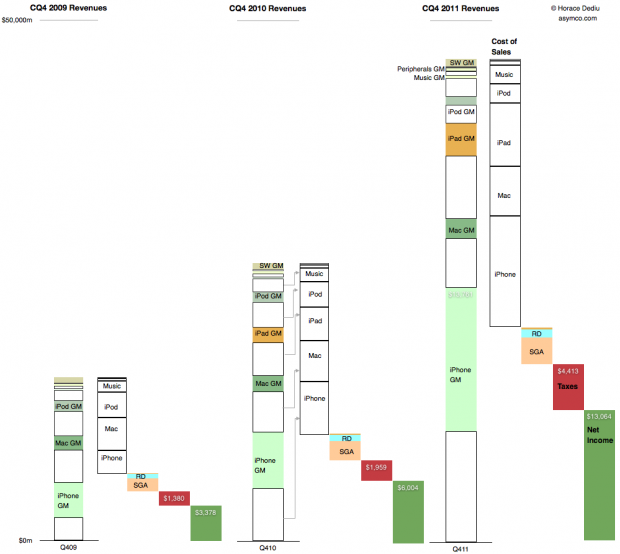
This is a summary view of Apple’s income statement for the fourth quarter of 2009, 2010 and 2011. The full size is 999×893 pixels. Click on image below for full size bitmap.
The convention used is to show revenues in the first column, cost of sales in the second followed by operating expenses, taxes and net income in the last (dark green) column.
For the revenue column, individual products are shown stacked from highest to lowest revenues and further divided into variable costs and gross margin.
The costs are then drawn separately leaving net income (or profit). Ratios between various quantities can be visualized:
- Gross Margin percentages are ratios between the empty boxes and their colored counterparts
- Operating expenses as a percent of sales are the third column in relation to the first.
- Tax rates are the fourth column as a percent of the fourth plus the fifth, etc.
- Finally, the rate of year-on-year growth in all these quantities can be seen by looking through column sets left to right.
Given this perspective it’s perhaps more obvious how much and from which business Apple has grown.

