
Apple’s capital expenditures for product tooling, manufacturing process equipment, corporate facilities and infrastructure has followed very closely their production of iOS devices. The pattern is shown in the graph below.
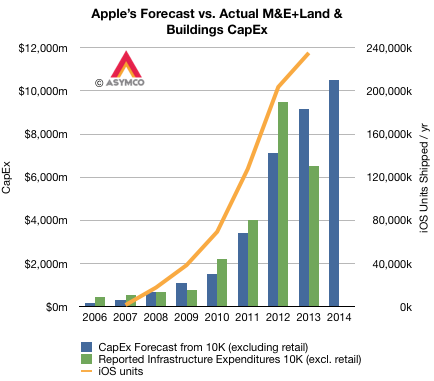
Note that although reported expenditures did not match forecasts for 2012 and 2013, the differences nearly cancel each other.1 The company’s forecast for fiscal 2014 is shown as well.
The orange line shows iOS unit production2 with the scale on the right-side axis. Note the correlation with forecasts on CapEx. The relationship can be seen more clearly in the following scatter plot.
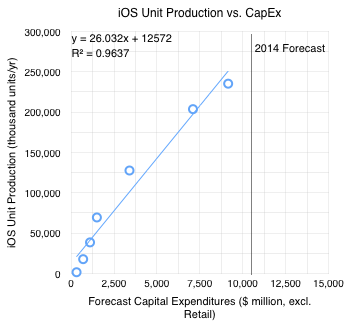
I added the 2014 Forecast ($10.5 billion from the latest 10-K filing). If the relationship holds into next year then the iOS unit shipments should be between 250 million and 285 million.3.