
The graph below shows the Revenue and Operating Income for a select group of companies. The large numbers represent the share price to earnings (trailing twelve months) ratio (P/E or PE ratio).
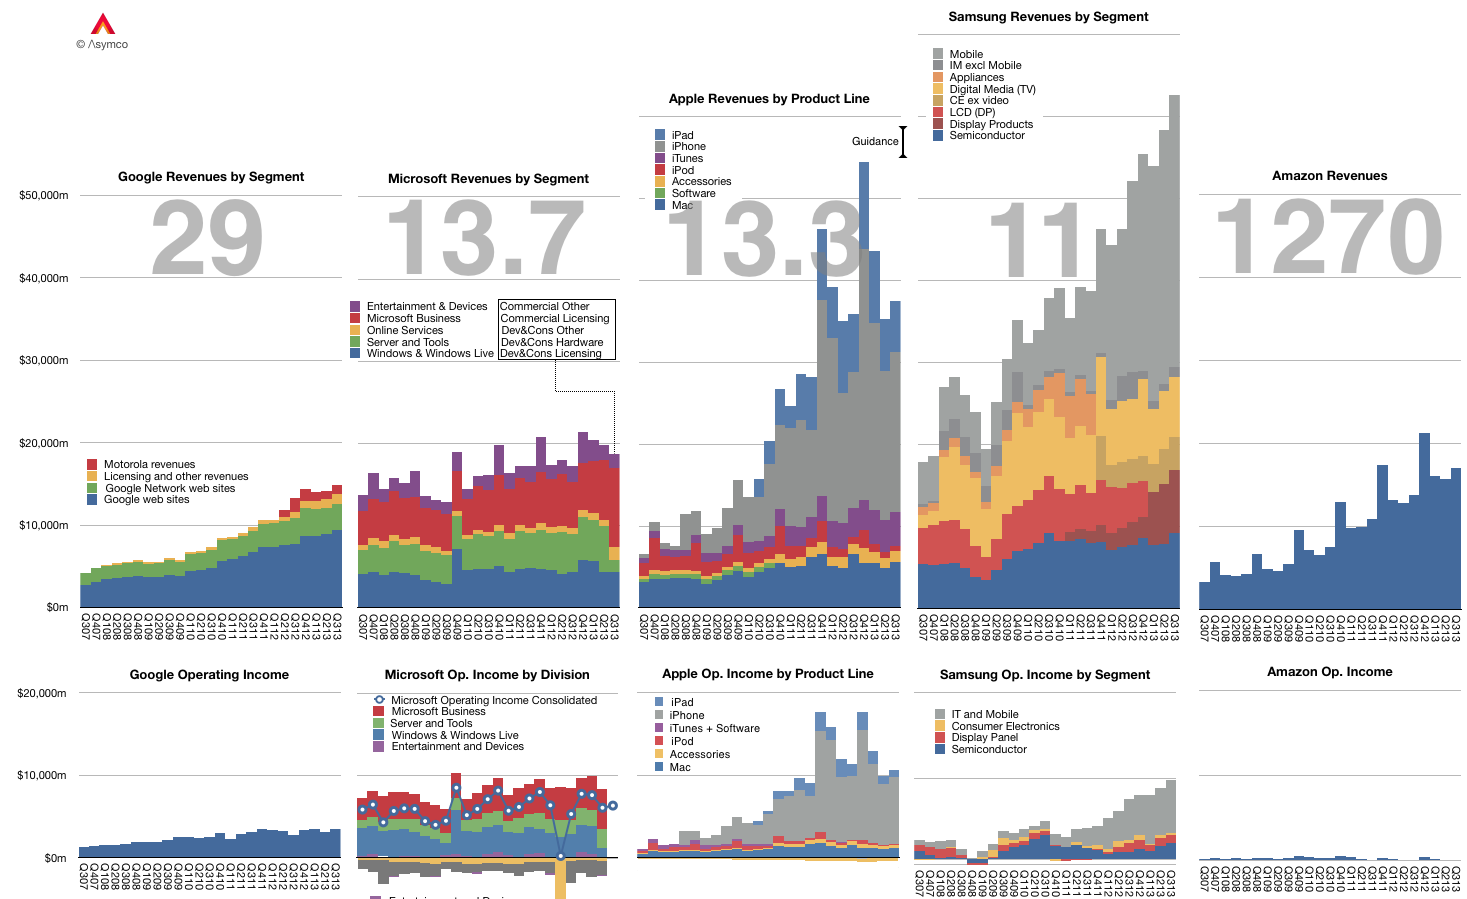
Of course the P/E ratio hides a lot of subtlety. It mostly fails to account for the fact that earnings are largely a matter of opinion. A company can defer income (as Apple and Microsoft do), it can invest earnings (as Amazon does) and can otherwise avoid declaring it since it’s taxable.
A better measure is the Enterprise Value to Free Cash Flow ratio (EV/FCF). It reflects a “harder” measure of performance in the form of free cash flow. It is not a matter of opinion but a fact. Enterprise Value also excludes cash which is a measure of past performance.
Nominally both P/E and EV/FCF measure the valuation of a company. They give what amounts to the number of years that current performance can be expected to last. For example a P/E or EV/FCF of 10 can be read as “If I purchase a share today, I should expect the company to pay me back in earnings in 10 years.” Any earnings after 10 years are essentially “profit” for the investor.
Inverted these ratios are a measure of Yield or how much of the total investment is paid back in a given year. In the example above, the Yield would be 10% or “If I purchase a share today, the company will pay me back 10% a year in earnings.”
Relying on P/E is troublesome since, as mentioned above, it’s deceptive. We get into difficulty when P/E and EV/FCF differ greatly. If a company has minimal cash and declares all free cash flow as earnings then the ratios are the same. However, consider how different these two ratios are for Apple:
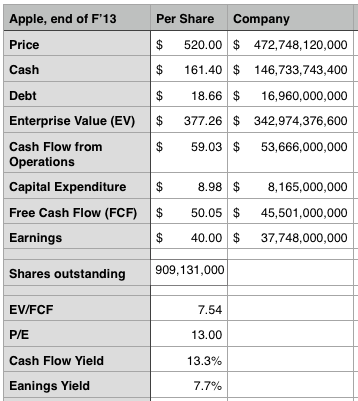
The P/E ratio is 13 while the EV/FCF is 7.5.1
This means the investment horizon is nearly half of what P/E suggests. (The cash flow yield should give pause). Put another way, the market suggests that Apple has 7 more years of current profitability and not 13. Note that the P/E ratio for the S&P 500 is above 19.
As Apple’s deferrals are increasing investors should look again at what the company’s worth. We had similar confusion when the company was deferring most of its iPhone revenue.
- It would be very interesting to have both ratios available for all the companies in the graph above. [↩]