Reasons for iOS outperformance in the US

The comScore mobiLens survey for the US ending February 2013 shows continuing rapid expansion of smartphone usage in the US. Even though the 50% penetration threshold was passed seven months earlier, the rate of new smartphone users was second highest ever recorded with over 1 million new-to-smartphones users every week during February.

Screen Shot 2013-04-05 at 4-5-4.15.52 PM

Overall penetration increased to 57% with nearly 2% of the population switching in one month. Using the average growth rate for the last six periods, the US could see 80% penetration in another 19 months or by Q3/Q4 2014.

Continue reading “Reasons for iOS outperformance in the US”

The cost of building Galaxies (and iPhones)

Although Samsung and Apple are acclaimed as the leaders in profit capture for smart (and otherwise) phones, what is not lauded is how much they spend on capital equipment used in the making of these phones.

In 2012 Samsung spent around $20 billion while Apple spent about $10 billion (excluding leasehold improvements or Apple stores but including real estate).

Compare these figures with Intel at $11 billion, Google at $3.2 billion, Microsoft about $2.8 billion and Amazon $3.8 billion (including presumably new distribution centers.)

Screen Shot 2013-04-04 at 4-4-5.51.15 PM

What each company spends on differs depending on its business model, but as the graph above shows it’s easy to see that there is a class of “big spenders” who spend so much that it makes it hard to imagine just what $10 billion/yr could actually buy.

To get an idea of just how big that figure is consider that Continue reading “The cost of building Galaxies (and iPhones)”

The cost of selling Galaxies, updated

Thanks to @jtk0621 via twitter I was able to obtain a quarterly view into Samsung’s SG&A expenditures by cost category.

The value of this data is in being able to understand why Samsung SG&A as a percent of sales remains fairly constant. To recap, the discrepancy with Samsung’s SG&A is that it has grown in proportion to rapidly rising sales. Normally, when sales grow, SG&A grows but when sales grow very rapidly, SG&A grows a bit more slowly since it’s primarily a function of headcount and hiring is necessarily organic and hence slower as a process.

The contrast is shown in the following comparison between Apple’s SG&A and Samsung’s SG&A as a percent of sales. [For more detail on Samsung revenue composition see: The Cost of Selling Galaxies].

Screen Shot 2013-04-02 at 4-2-3.09.39 PM

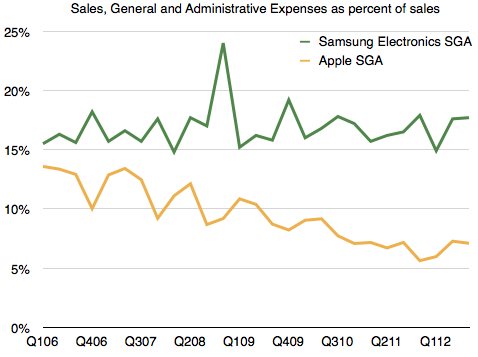
Apple’s SG&A has declined as a percent of sales, as one would expect, but Samsung’s hasn’t.

I have hypothesized that the reason for this might be in the practice of “outsourcing” many marketing functions. As Samsung expands promotional efforts, it does so partially by hiring people but even more so by farming out a lot more work. In this way, if and when sales subside, it can pare costs. This practice ensures that it’s not exposed to a huge cost structure that is hard to control. The downside to this approach might be obtaining “quality” marketing as oversight is still depending on inside teams who still have limited resources.

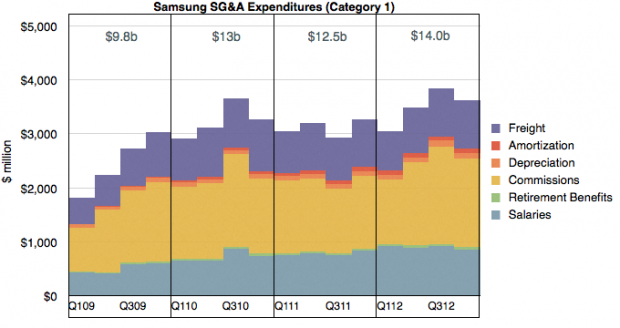
To test this hypothesis, I looked at the types of costs it reports and divided them into two categories:

Category 1 are what might be considered “internal” costs which are in function of employees or operations. These costs are:

  • Salaries
  • Retirement Benefits
  • Commissions
  • Depreciation
  • Amortization
  • Freight

I graphed these costs over time below:

Screen Shot 2013-04-02 at 4-2-3.12.09 PM

Category 2 costs are those which can be “outsourced” and are in function of budget items. These are: Continue reading “The cost of selling Galaxies, updated”

How many iPhones will T-Mobile USA sell?

From the initial product launch until the end of 2012, AT&T has activated 72 million iPhones. Verizon began selling iPhones four years after AT&T and managed to activate 26 million since. Sprint began nine months after Verizon and has activated 8.5 million.

In proportion of their subscriber bases, the activations are shown in the following graph.

Screen Shot 2013-03-28 at 3-28-12.50.06 PM


I identified the reported iPhone activations with blue areas while the sum of green and blue areas represent total subs at the end a the given year.

I also took the liberty of forecasting 2013 data in order to try to estimate T-Mobile’s contribution.

Continue reading “How many iPhones will T-Mobile USA sell?”

Apple retail vs. Amazon retail

As part of a continuing series on the iTunes economy I described how iTunes fits within Apple’s overall revenue and cost structure. The operation is a modest contributor accounting for single-digits percent of revenue and operating margins.

One additional question is how does iTunes compare with other non-Apple retail businesses. The obvious comparable businesses are Google Play and Amazon’s digital content businesses. Unfortunately we can’t compare iTunes with Google Play because Google does not reveal any details about Play revenues (or units sold/downloaded or payments to developers or any other data.)

Also unfortunately, we can’t compare iTunes with Amazon digital sales because Amazon does not provide that detail either.

What we do have is Amazon’s overall revenues (and operating margin.) So that’s what I have compared:

Screen Shot 2013-03-27 at 3-27-2.09.30 PM

Since we have Amazon’s overall retail revenues it seemed fitting to also add Apple’s physical store retail data on top of iTunes for additional perspective.

Here are some observations: Continue reading “Apple retail vs. Amazon retail”

iTunes Segment Revenues in Context

In the last few posts I estimated the iTunes economy in some detail. In absolute figures, the revenues and cost structures of iTunes are substantial:

  • 6.3 billion transactions in the last quarter
  • $4.6 billion consolidated revenues (including software & services)
  • $3.3 billion in content payments
  • $650 million in operating income

However, as a part of the entire Apple revenue model, iTunes appears to be a small contributor. The following diagrams shows where revenues came from and where they were spent during the last quarter

Sankey-Income1

A few notes: Continue reading “iTunes Segment Revenues in Context”

The Critical Path #77: Making Sausages

The more we deconstruct and take apart iTunes, the more we come to respect how is cannot exist independent of the system it’s a part of. Its scope and scale and its history and future all indicate that there is more to it than just a store and that it might be a platform in its own right. We get into some more details about all these details and talk about where it came from and where we think it will end up.

via 5by5 | The Critical Path #77: Making Sausages.

So long, break-even

The following is another excerpt from a report titled “iTunes Business Review” which will soon be available for purchase through the Asymco Store. If you are interested in the product please get in touch.

iTunes store will be 10 years old next month. From its inception Apple has stated that it aims to run the store “at break-even”.  The business has grown so rapidly however that its profit-free nature has come under severe pressure.

The reasoning goes that as more media types have been added costs have increased but revenues have increased even faster. Consider the estimated gross revenue base as shown below:

Screen Shot 2013-03-22 at 3-22-2.39.55 PM

What is known as iTunes today has quintupled in seven years. Although cost of content sales are likely to have been preserved as a ratio (about 30%) the vastness of transaction volume (estimated at 23 billion item transactions in 2012 alone) implies that there are some significant economies of scale.

This implies that the operating costs are spread more evenly and that therefore the possibility exists for some operating margin. Continue reading “So long, break-even”